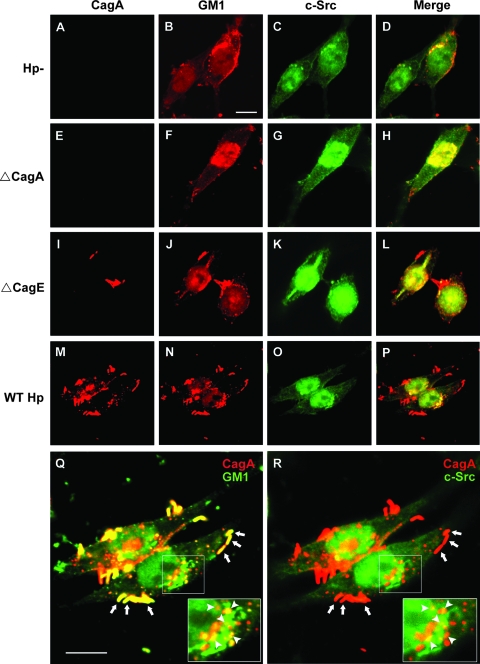
FIG. 2.
Distribution of adhered bacteria, translocated CagA, GM1, and c-Src in infected AGS cells. Untreated AGS cells (A to D), ΔCagA-infected cells (E to H), ΔCagE-infected cells (I to L), and wild-type H. pylori-infected cells (M to P) were fixed and stained with goat anti-CagA, rabbit anti-c-Src, and Alexa Fluor 555-conjugated CTX-B to visualize GM1, followed by Cy5-conjugated anti-goat and FITC-conjugated anti-rabbit antibodies. Red, CagA; pseudored, GM1; green, c-Src. Yellow in the merged images (D, H, L, and P) indicates colocalization of GM1 and c-Src. (M to R) AGS cells were cocultured with wild-type H. pylori at 37°C for 6 h and then fixed and stained, and this was followed by observation by confocal fluorescence microscopy as described above. For two merged images (panels Q [CagA and GM1] and R [CagA and c-Src]), the framed region was magnified, and the magnified images are shown in the lower right corner. Areas of colocalization of CagA and GM1 (Q) or CagA and c-Src (R) in the cell (right) are indicated by arrowheads. The adhered H. pylori bacteria in the cell (right) are indicated by arrows. Scale bars, 10 μm. Hp−, not treated with H. pylori; WT Hp, treated with wild-type H. pylori.

