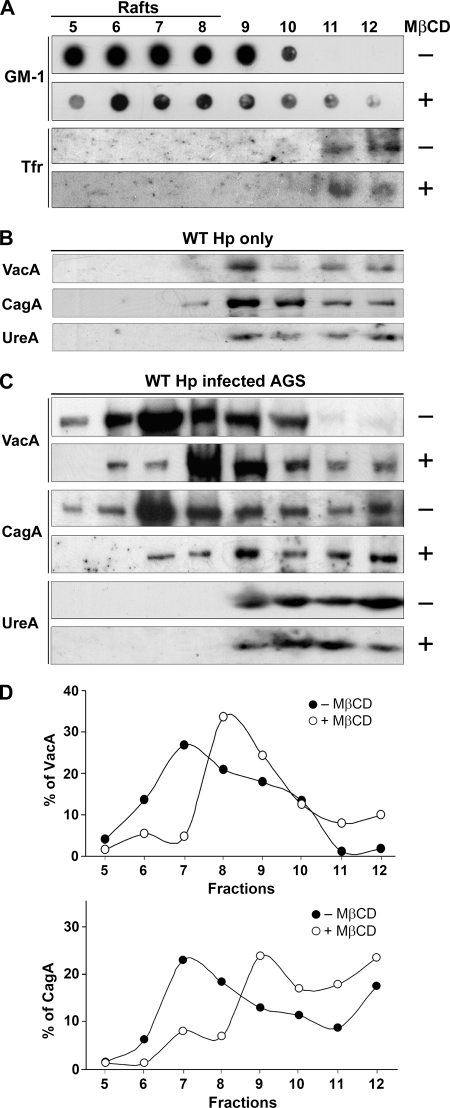
FIG. 4.
The distribution of CagA and VacA in infected cells shifted from DRMs to non-DRMs upon cholesterol depletion. (A) Infected AGS cells were subjected to fractionation in an Optiprep density gradient at 4°C. Each fraction was assayed for GM1 with HRP-conjugated CTX-B using dot blot analysis and was assayed for the transferrin receptor with anti-Tfr antibody using Western blot analysis. (B) Pure bacteria were subjected to fractionation in an Optiprep density gradient at 4°C. Each fraction was assayed for VacA, CagA, and UreA using Western blot analysis. (C) AGS cells were infected with H. pylori 26695, which was followed by fractionation in an Optiprep density gradient at 4°C. For cholesterol depletion, cells were treated with 5.0 mM MβCD for 1 h prior to incubation. Each fraction was assayed for VacA, CagA, and UreA using Western blot analysis. (D) VacA (upper panel) and CagA (lower panel) signals in each fraction from panel C were detected and expressed as relative intensities. WT Hp, wild-type H. pylori.

