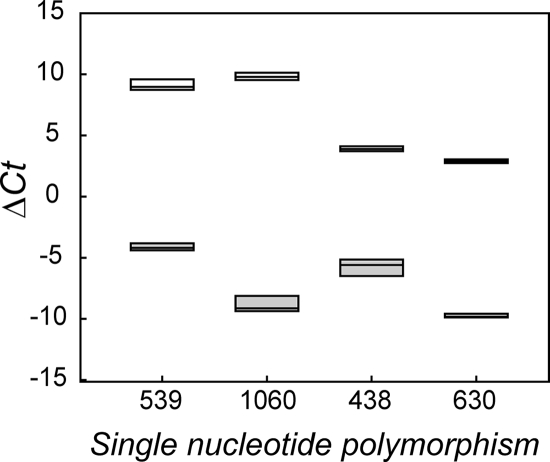
FIG. 2.
Box plot of mean ΔCT as a function of SNP for colony picks from SMAC. Open plots represent the mean ΔCT values for positive control strains for each SNP, including strains Spinach (SNP 539), Sakai (SNP 1060), 93-111 (SNP 438), and EDL933 (SNP 630); filled plots represent the mean ΔCT values for the negative control strain, strain MG1655.

