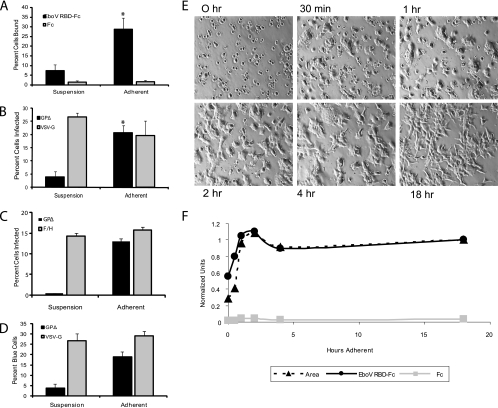
FIG. 3.
EboV RBD binding to, and pseudotype infection of, adherent and suspension 293F cells. (A) 293F cells were maintained in suspension on a rotating platform or allowed to adhere without being shaken for 18 h in the same CO2 incubator. Cells then were assayed for EboV RBD binding as described in the legend to Fig. 1A. (B) 293F cells were treated as described for panel A, challenged with VSV-GPΔ or VSV-G at a multiplicity of infection (MOI) of 2 for 18 h, and scored for infection by flow cytometry. Results shown in panels A and B are the averages from three or more experiments and error bars represent standard deviations, with asterisks indicating statistically significant differences from the suspension 293F cell data (P < 0.015). (C) 293F cells were treated as described for panel A, challenged with VSV-GPΔ or VSV-measles virus F/H at an MOI of 2 for 18 h, and scored for infection by flow cytometry. The averages from duplicate samples from one representative of two experiments are shown. (D) 293F cells were treated as described for panel A and assayed as described in the legend to Fig. 2C, using Ebola virus GPΔ or VSV-G bearing human immunodeficiency virus pseudoparticles harboring β-lactamase. The average results from duplicate samples are shown. (E) 293F cells were left in suspension or allowed to adhere. Cells were photographed at the indicated times using a Spot Insight Color camera attached to a Nikon Diaphot microscope. (F) The cells shown in panel E were examined for cell spreading (▴) and EboV RBD binding (•). Cell spreading was determined by a blind analysis of micrographs such as those shown in panel E by using EZ-C1 Freeviewer 3.0 software from Nikon. The perimeter of 10 cells per field (for 3 or more fields) was outlined to generate cell area data. Cell areas for each time point were averaged and normalized to the area of cells that were plated for 18 h. The binding of the EboV RBD (•) and Fc control (▪) were assayed as described in the legend to Fig. 1B and normalized to the values for EboV RBD binding to cells that were allowed to adhere for 18 h. The data in panels E and F are from one of three experiments that yielded virtually identical results.

