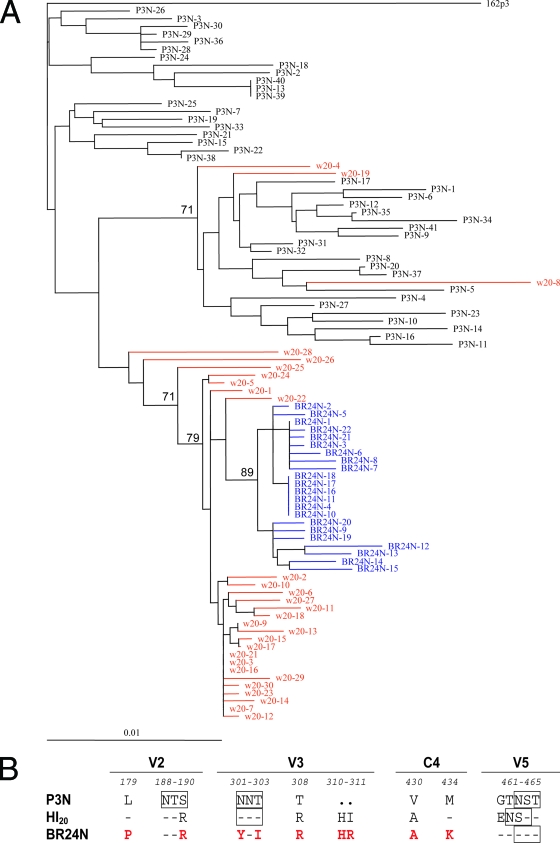
FIG. 2.
(A) Phylogenetic tree showing the relationship between the Env V1 to V5 sequences of the parental R5 SHIV162P3N, the week 20 variants, and the final X4 SHIVBR24N. A neighbor-joining tree was generated, with the SHIVSF162P3 sequence serving as an outgroup. Week 20 plasma sequences are marked in red while those of the X4 SHIVBR24N isolate are in blue. The scale bar indicates genetic distances along the horizontal branches. The values on the branches represent the percentage of bootstrapped trees out of 1,000 replicates. Sequence gaps are excluded for analysis. (B) Comparison of the predicted V2, V3, C4, and V5 gp120 amino acid sequences of SHIVSF162P3N, SHIVBR24N, and week 20 Envs. The nine amino acids in X4 SHIVBR24N that differed from R5 SHIVSF162P3N Env gp120 are indicated in red. Dashes denote similarity in sequence, dots indicate gaps, and the PNG sites are boxed. Residues that differ between the viruses are numbered based on their relative positions in the HXB2 sequence. w, week.

