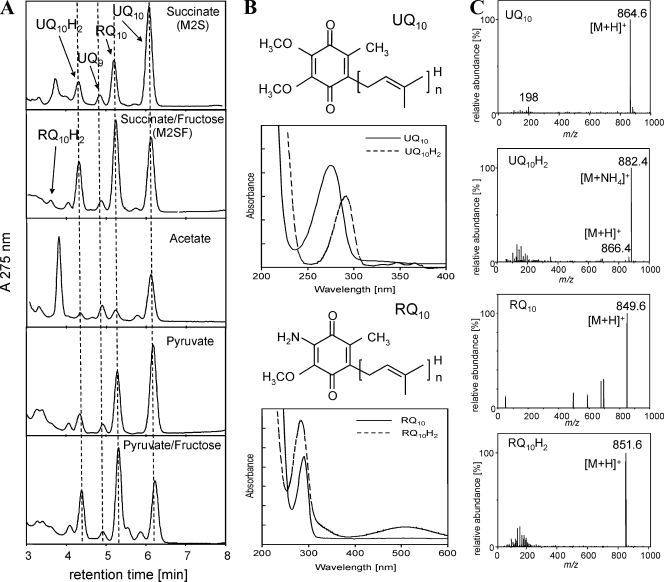
FIG. 2.
HPLC-DAD-MS analysis of quinone extracts. (A) HPLC profiles. Dashed lines are applied to facilitate the identification of quinone peaks. (B) DAD-UV spectra of UQ10 (λmax = 275 nm), UQ10H2 (λmax = 292 nm), RQ10 (λmax = 284 nm), and RQ10H2 (λmax = 290 nm). (C) MS signals (only the monoisotopic masses are indicated for clarity) obtained with APCI could be attributed to the following ions: for UQ10, m/z 864.6 to [M+H]+ and m/z 198.0 to a benzylium ion, a characteristic fragment of the UQ ring structure; for UQ10H2, m/z 882.4 to [M+NH4]+, m/z 866.4 to [M+H]+, and m/z 198.0 to a benzylium ion; for RQ10, m/z 849.6 to [M+H]+; and for RQ10H2, m/z 851.6 to [M+H]+. The last compound could be detected only when M2SF was used for cultivation under oxygen-limiting conditions. The signals obtained for UQ9 (not shown) were m/z 795.6 (M+) and m/z 812.8 ([M+NH4]+).

