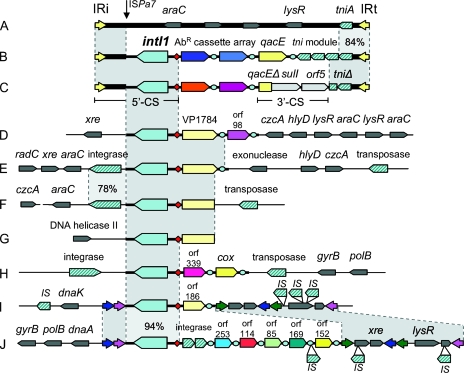
FIG. 1.
Schematic maps of class 1 integrons and associated elements, including Tn6008 from Enterobacter cloacae JKB7 (A), an example of a Tn402 integron (B), and a typical clinical class 1 integron (C). Below these, class 1 integrons from Hydrogenophaga strain PL2G6 (D), Aquabacterium strain PL1F5 (E), Acidovorax strain MUL2G8 (F), Imtechium strain PL2H3 (G), Azoarcus strain MUL2G9 (H), Thauera strain B4 (I), and Thauera strain E7 (J) are shown. Symbols are as follows: red diamonds, attI1 sites; blue circles, 59-be; block arrows, genes (showing the direction of transcription, with diagonal blue stripes indicating transposases, recombinases, or IS elements and solid colors indicating cassette-encoded genes or the class 1 integron-integrase gene intI1); colored arrowheads, inverted repeat regions, including IRi and IRt associated with Tn402 (yellow) and those found in Thauera chromosomal integrons (pink, blue and green); shaded regions, nucleotide homology between elements. Where this homology falls below 99%, the percent identity is given. The vertical arrow indicates the breakpoint for sequence homology between clinical and chromosomal class 1 integrons and is also the insertion point for ISPa7. Selected genes outside the integron are named. Generally, these genes have phylogenetic relationships that are consistent with vertical inheritance from a common betaproteobacterial ancestor. Other symbols are defined in the text.

