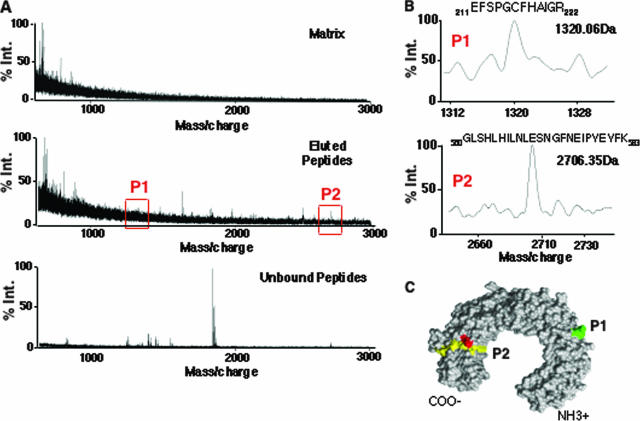
FIG. 6.
Initial mapping of the interaction between ODN2006 and 3ECD. (A) Identification of peptides derived from 3ECD that can be reversibly cross-linked to ODN2006. The three mass spectra are of ions associated with the matrix, ions eluted from ODN2006-resin, and ions that were not cross-linked to the resin. Regions of the spectra in the eluted peptides match to theoretical peptides P1 and P2 that were generated from 3ECD (red boxes). % Int, percentage of peak intensity. (B) Expanded views of the P1 and P2 spectra, along with the residues of the two peptides assigned to these masses. (C) The locations of peptides P1 and P2 within the three-dimensional model of 3ECD (PDB accession number, 1ZIW). The peptide spanning residues 211 to 222 is in green, and the one spanning residues 560 to 583 is in yellow. Red denotes the location of residue H539, which has been identified as contacting dsRNA (6).

