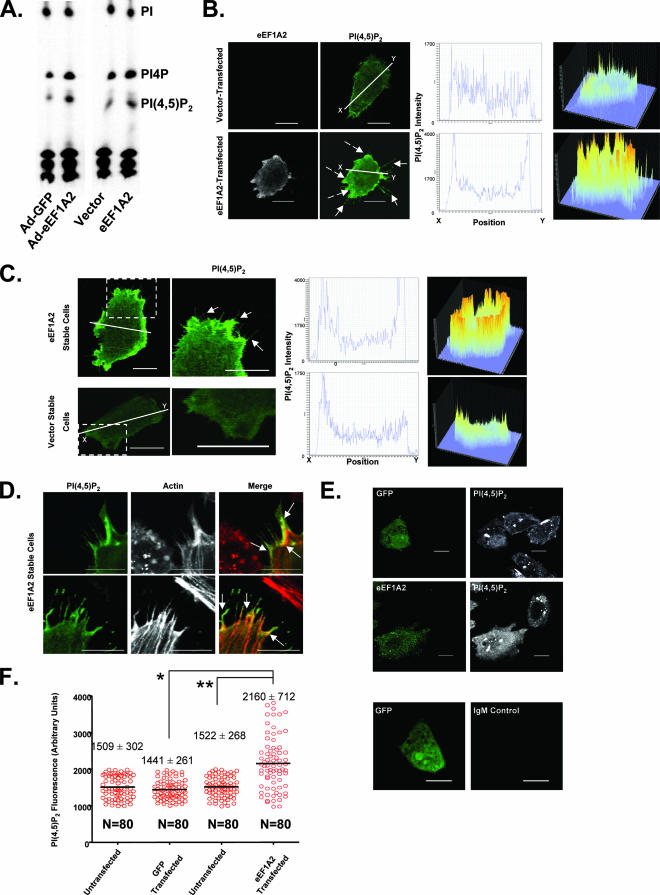
FIG. 3.
eEF1A2 stimulates overall accumulation and membrane localization of PI(4,5)P2. (A) TLC of labeled phosphatidylinositol from Rat2 cells transduced with either a GFP-adenovirus (Ad-GFP) or an eEF1A2-adenovirus (Ad-eEF1A2) or from vector only or eEF1A2-expressing stable cells. The TLC shown is a representative sample of three independent experiments. (B) Rat2 cells, transiently transfected with eEF1A2, show greater membrane-localized PI(4,5)P2 fluorescence (dashed arrows) than vector-transfected cells. The first and second columns (at left) show eEF1A2 and PI(4,5)P2 staining, respectively. The third column (middle) shows a cross-section of PI(4,5)P2 fluorescence intensity along the white line indicated in the second column. The fourth column (at right) shows a three-dimensional (3D) representation of PI(4,5)P2 staining in the entire cell. (C) eEF1A2-expressing Rat2 stable cells show greater membrane-bound PI(4,5)P2 than vector stable cells. First and second columns (at left) show PI(4,5)P2 staining. The third column (middle) shows a cross-section of PI(4,5)P2 fluorescence intensity along the line indicated in the first column. The fourth column (at right) shows a 3D representation of the PI(4,5)P2 staining pattern of cells seen in the first column. Filopodium-like structures are visible (solid arrows). (D) Colocalization of PI(4,5)P2 and actin in eEF1A2-expressing Rat2 cells. Some colocalization is observed along the bases of the filopodia, as well as along the filopodia (arrows). (E) Rat2 cells transfected with either eEF1A2 or GFP, stained for eEF1A2 (green) or GFP (green) and for PI(4,5)P2 (white). eEF1A2-transfected cells show more intense PI(4,5)P2 staining than either GFP-transfected cells or untransfected control cells. The bottom two panels show a GFP-transfected cell stained with the IgM secondary antibody alone. (F) Quantification of the PI(4,5)P2 fluorescence in the GFP control-transfected cells or the eEF1A2-transfected cells. Red circles represent fluorescence intensity in individual cells, with the means and standard deviations for each transfection condition indicated. eEF1A2-transfected cells have significantly more PI(4,5)P2 fluorescence than controls (* and **, P < 0.0001, Mann-Whitney test). Scale bars represent 10 μm.

