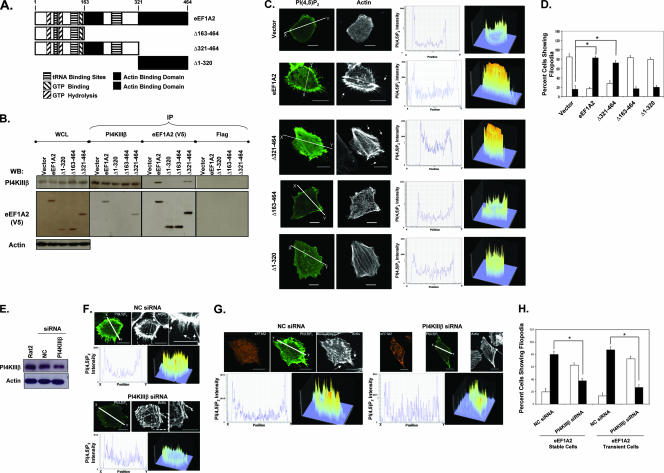
FIG. 5.
eEF1A2-PI4KIIIβ interaction is necessary for eEF1A2-mediated development of filopodia. (A) Schematic domain map of eEF1A2 and the generated mutants. (B) Polyclonal cell lines expressing eEF1A2 or mutants were used for coprecipitation analysis with PI4KIIIβ. Whole-cell lysate (WCL) lanes indicate expression of PI4KIIIβ and eEF1A2 in the cell lines used. eEF1A2 is V5 tagged, and actin is used as a loading control. Reciprocal PI4KIIIβ and eEF1A2 coimmunoprecipitation proteins were detected by immunoprecipitation (IP) with the indicated antibody, followed by the indicated Western blotting antibody. No precipitation of either protein was detected using the Flag antibody control. The WCL lane contains 40 μg of total cellular protein, and each IP was performed using 250 μg of protein lysate. (C) eEF1A2 mutants that cannot bind PI4KIIIβ do not show increased membrane-bound PI(4,5)P2 staining or any formation of filopodia. The first and second columns (at left) show PI(4,5)P2 and actin staining, respectively. The third column (middle) shows a cross-section of PI(4,5)P2 fluorescence intensity along the white line indicated in the first column. The fourth column (at right) shows a three-dimensional representation of PI(4,5)P2 staining in the entire cell. (D) Quantification of filopodia (n = 142, 158, 132, 133, and 135 for vector, eEF1A2, Δ163-to-464, Δ1-to-320, and Δ321-to-464 stable cells, respectively). Filled columns indicate cells with at least 10 filopodia greater than or equal to 3 μm in length. Open columns indicate cells with any number of filopodia less than 3 μm in length. Significance (P < 0.05, Student's t test) is indicated by an asterisk. (E) Western blots showing downregulation of PI4KIIIβ in Rat2 cells using siRNA. (F) Downregulation of PI4KIIIβ in eEF1A2-expressing Rat2 stable cells leads to a decrease in membrane-bound PI(4,5)P2 and a decrease in the number and length of filopodia. (G) Data shown are the same as in panel F, except Rat2 cells are transiently expressing eEF1A2. (H) Quantification of filopodia (n = 141, 157, 122, and 127 for negative control [NC; stable], PI4KIIIβ [stable], NC [transient], and PI4KIIIβ [transient], respectively). Filled columns indicate cells with at least 10 filopodia greater than or equal to 3 μm in length. Open columns indicate cells with any number of filopodia less than 3 μm in length. Significance (P < 0.05, Student's t test) is indicated by an asterisk. Scale bars represent 10 μm.

