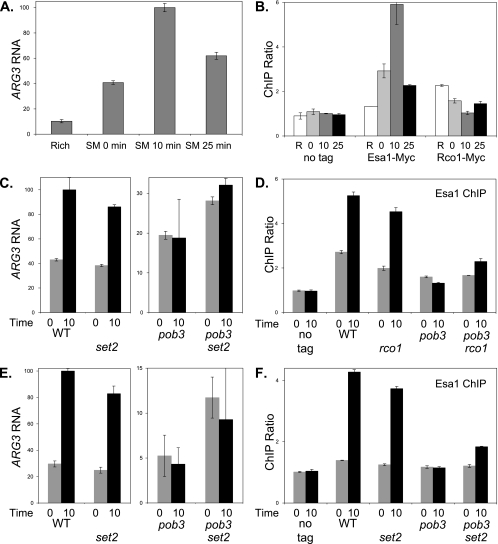
FIG. 7.
pob3 and rco1 affect ARG3 induction and NuA4 binding. (A) Strain DY150 (wild type) was grown at 25°C in rich medium, and then cells were transferred to minimal medium containing SM to starve cells for amino acids. Samples were taken before the shift and at 0, 10, and 25 min following the shift. RNA was isolated, and mRNA levels were determined by reverse transcription (RT)-PCR for ARG3 and ACT1 (internal control). The results are given as the ratio of ARG3 to the ACT1 internal control, with the error bars showing the standard deviation of the triplicate PCRs. (B) Strains DY150 (no tag), DY12268 (Esa1-Myc), and DY11045 (Rco1-Myc) were starved for amino acids as in panel A, and ChIP assays were performed to measure Esa1-Myc and Rco1-Myc binding to the ARG3 promoter. “R” indicates Rich medium, and the numbers indicate the time after transfer to starvation medium. PCR assays were also performed to measure protein occupancy at a control locus on chromosome I. The results give the ratio of the ChIP signals at ARG3 to the control interval, and error bars show the standard deviations of the ChIP PCRs performed in triplicate. (C) Strains DY150 (wild type [WT]), DY10398 (rco1), DY8881 [pob3(L78R)], and DY10406 [pob3(L78R) rco1] were starved for amino acids as in panel A. RNA was isolated, and mRNA levels were determined by RT-PCR for ARG3 and ACT1 (internal control). “0” and “10” indicate time after the shift to starvation conditions. The results are given as the ratio of ARG3 to the ACT1 internal control, with the error bars showing the standard deviations of the triplicate PCRs. Note that the scales for the left and right panels are different. (D) Strains DY150 (no tag), DY12268 (Esa1-Myc), DY12343 (Esa1-Myc rco1), DY12270 [Esa1-Myc pob3(L78R)], and DY12342 [Esa1-Myc pob3(L78R) rco1] were starved for amino acids as in panel A, and ChIP assays were performed to measure Esa1-Myc binding to the ARG3 promoter. “0” and “10” indicate time after the shift to starvation conditions. The results give the ratio of the ChIP signals at ARG3 to the control interval, and error bars show the standard deviation of the ChIP PCRs performed in triplicate. (E) Strains DY150 (wild type), DY8780 (set2), DY8881 [pob3(L78R)], and DY8877 [pob3(L78R) set2] were starved for amino acids as in panel A. RNA was isolated, and mRNA levels were determined by RT-PCR for ARG3 and ACT1 (internal control). “0” and “10” indicate time after the shift to starvation conditions. The results are given as the ratio of ARG3 to the ACT1 internal control, with the error bars showing the standard deviation of the triplicate PCRs. Note that the scales for the left and right panels are different. (F) Strains DY150 (no tag), DY12268 (Esa1-Myc), DY12339 (Esa1-Myc set2), DY12270 [Esa1-Myc pob3(L78R)], and DY12337 [Esa1-Myc pob3(L78R) set2] were starved for amino acids as in panel A, and ChIP assays were performed to measure Esa1-Myc binding to the ARG3 promoter. “0” and “10” indicate time after the shift to starvation conditions. The results give the ratio of the ChIP signals at ARG3 to the control interval, and error bars show the standard deviations of the ChIP PCRs performed in triplicate.

