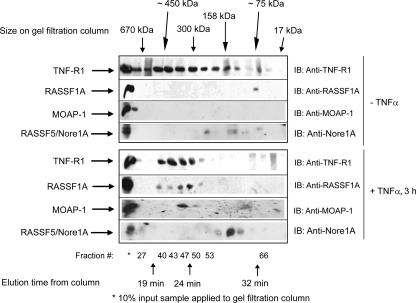
FIG. 2.
Gel filtration analysis of complex formation of endogenous TNF-R1, MOAP-1, and RASSF1A. U2OS cells were grown on 4- by 10-cm2 dishes and left unstimulated or stimulated with TNF-α. Cells were lysed by scraping into 1 ml of 1× PBS, combined, and lysed in 800 μl of RIPA buffer. After lysate was clarified by centrifugation, supernatant was dialyzed against HPLC washing buffer (50 mM Tris [pH 8.0], 150 mM NaCl, 2 mM EGTA) with 1 liter of buffer overnight and then 1 liter of buffer for 8 h the next day. The dialyzed sample was then concentrated to ∼200 μl, and 150 μl was applied to an analytical HPLC gel filtration Superose 200 column. The flow rate applied was 400 μl/min, and 200-μl fractions were collected in a 96-well plate. The column was standardized using Bio-Rad's gel filtration standard mixture of thryoglobulin (∼670 kDa, with an elution time of 19.5 min); gamma globulin (∼158 kDa, with an elution time of 27 min), ovalbumin (∼44 kDa, with an elution time of 35 min), myoglobin (∼17 kDa, with a retention time of 38 min), and vitamin B12 (∼1.3 kDa, with an elution time of 47 min). Fractions were then analyzed by sodium dodecyl sulfate-polyacrylamide gel electrophoresis. This experiment was carried out three times with similar outcomes. A representative experiment is shown for complex formation between TNF-R1, MOAP-1, and RASSF1A, with additional immunoblotting (IB) for RASSF5/Nore1A. Approximate locations of gel filtration standards, fraction numbers, and elution times are indicated.

