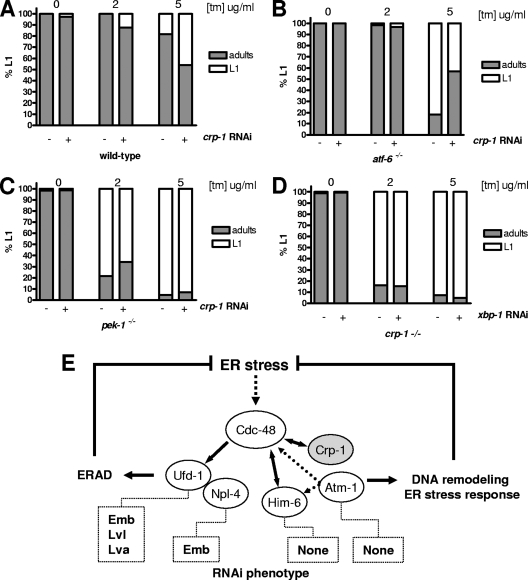
FIG. 8.
Genetic interaction map linking crp-1 and the UPR proximal sensors. (A to C) The percentage of progeny arrested in the L1 stage of development was plotted against different concentrations of TM (2 or 5 μg/ml) for N2 (A), pek-1−/− (B), and atf-6−/− (C) animals subjected or not to crp-1 RNAi. (D) The percentage of progeny arrested in the L1 stage of development was plotted against different concentrations of TM (2 or 5 μg/ml) for crp-1−/− animals subjected to xbp-1 RNAi. (E) Schematic representation of CDC-48-dependent pathways proposed to explain the implication of CRP-1, HIM-6, and ATM-1 in the regulation of ER homeostasis during stress condition through DNA remodeling/transcriptional processes.

