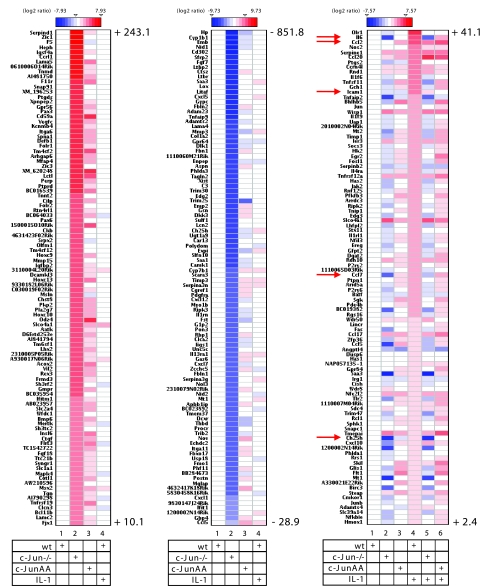
FIG. 11.
Identification of c-Jun-dependent genes by high-density DNA microarray experiments. RNAs from three independent preparations as shown in Fig. 1C were pooled, and expression of 18,194 genes was analyzed by oligonucleotide DNA microarray experiments. Ratios of expression values relative to unstimulated wild-type cell values were log2 transformed and are visualized as heatmaps, as indicated by color scales. The three panels shown indicate the top-ranking 100 genes that are upregulated in c-Jun-deficient cells (left panel), downregulated in c-Jun-deficient cells (middle panel), or induced by IL-1 (right panel). Numbers indicate highest and lowest severalfold regulation results for upregulated genes (left panel, lane 2), downregulated genes (middle panel, lane 2), and IL-1-regulated genes (right panel, lane 4). The full data set is available upon request. Details are described in Materials and Methods. Arrows indicate visualized mRNA expression values for genes (ccl2, il6, icam1, ccl7, and ch25h) as validated using real-time PCR (Fig. 1D; also see Fig. S1 in the supplemental material).

