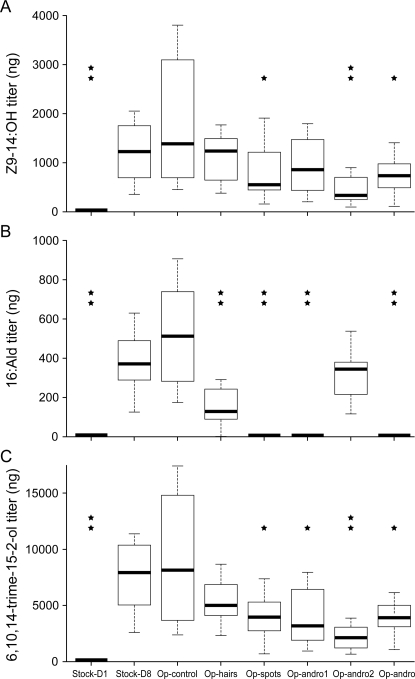
Figure 4. Component titres, after log-transformation, according to treatment.
(A) Z9-14:OH (one-way ANOVA: R2 = 0.93; F7,55 = 98.39, p<2. 10−16); (B)16:Ald (one-way ANOVA: R2 = 0.94; F7,55 = 98.39, p<2. 10−16); (C) 6,10,14-trime-15-2-ol (one-way ANOVA: R2 = 0.86; F7,55 = 98.39, p<2.10−16). The horizontal line in each box shows the median titre for each treatment. The bottom and top of the box show the 25 and 75 percentiles, respectively. The horizontal line joined to the box by the dashed line shows 1.5 times the inter-quartile range of the data. The stars represent a significant decrease in pheromone titre compared to the op-control group (*: 0.01<p<0.05; **: p<0.001). Treatment codes are given in the section “Material and Methods”.

