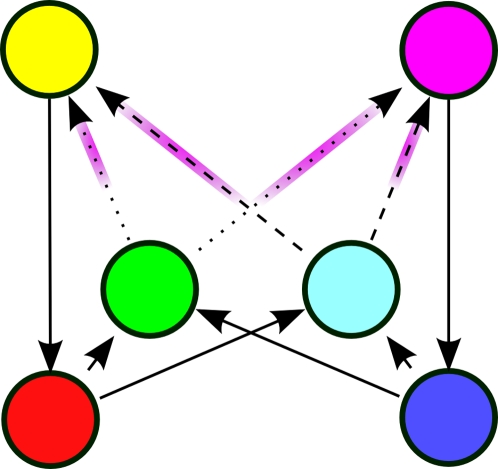
Figure 3. Observed cued alternation task.
This shows the structure of the cued alternation task as observed by the agent. Starting at red or blue, one of the two cues green or cyan is randomly selected and the agent can enter either the yellow or magenta observations, before returning to the bottom for another trial. Transition arrows colored magenta indicate transitions that may provide either positive or negative rewards (depending on whether the agent has alternated or has selected the same response for the current cue).

