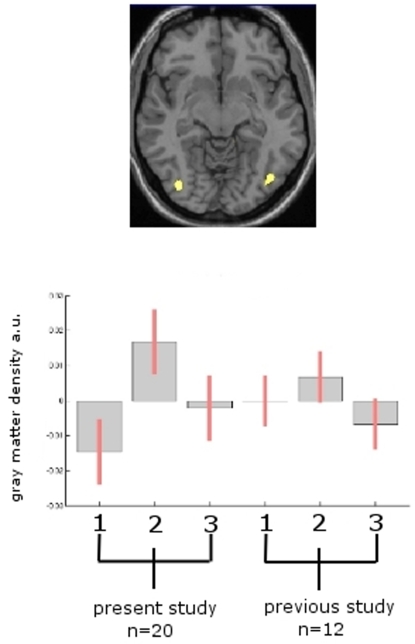
Figure 3. Mean effects analysis.
Figure 3 top: The mean effect analysis of the previous data set (1.5 Tesla) of 12 volunteers [1] and the present data set (3 Tesla) of 20 volunteers showed that both cohorts exhibit transient gray matter increase in the hMT/V5 bilaterally (right: x = 41, y = −82, z = 4; Z = 4.06; left: x = −38, y = −80, z = 2; Z = 3.12). Figure 3 bottom: Box plot of the parameter estimates for both samples in the MT-area (right hMT/V5) using the contrasts described in the text to test for medium effects in both groups (no conjunction). The cluster is displayed with p<0.001 (uncorr.) and all parameter estimates (betas) in this cluster were averaged.

