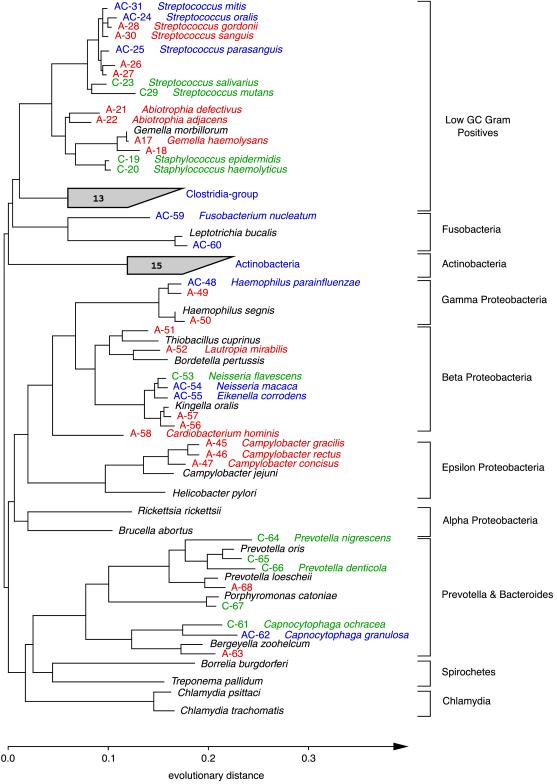
Figure 2.
Phylogenetic relationships of bacteria detected in a subgingival specimen, inferred from 16S rDNA sequence analysis. This unrooted tree was constructed by using 489 homologous sequence positions (534–1,050; E. coli numbering) and a maximum-likelihood algorithm. Sequences were given a colored alphanumeric designation according to whether they were amplified directly from the specimen (A; red), obtained from organisms cultivated from the specimen (C; green), or found by both methods (AC; blue). An organism name is provided adjacent to an alphanumeric designation when a sequence generated from this study was ≥99.0% identical to a sequence in a public database. Sequences selected from a public database for purposes of reference (not detected in the specimen) are indicated with the organism name in black. The number within each shaded fan indicates the total number of unique (amplified and cultivated) phylotypes within the group.

