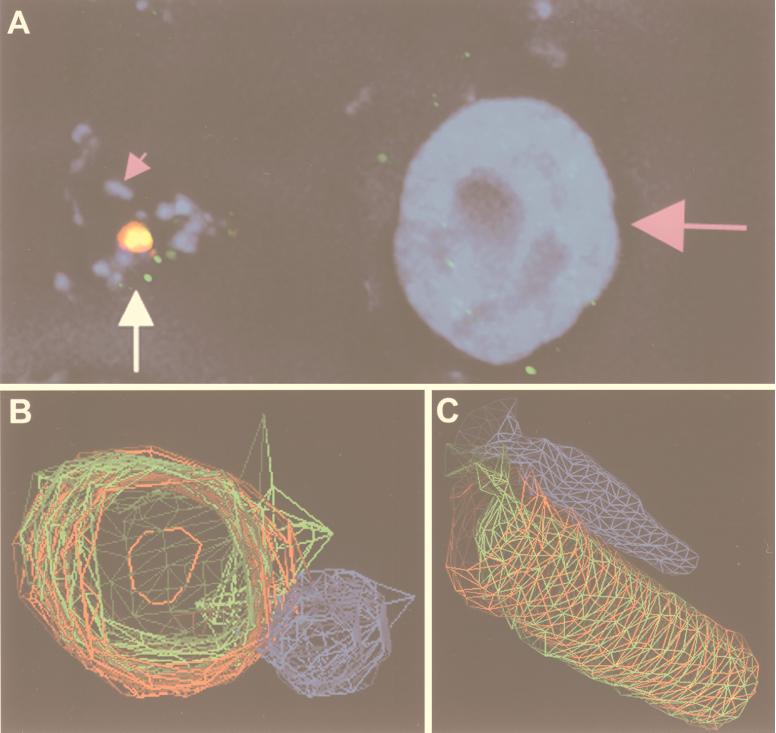
Figure 2.
Deconvolution immunofluorescence and 3D modeling of H. pylori attached to AGS cells. (A) H. pylori strain G27 attached to AGS cells was stained with DAPI [which stains the host-cell nucleus (large pink arrow) and bacteria (small pink arrow) nuclear DNA blue], anti-CagA (red), and antiphosphotyrosine (green). Colocalization of green and red appears yellow. The image is a composite of 0.2-μm Z-axis sections. The region indicated by the white arrow in A was used to generate the 3D wire models shown in B and C. C is a longitudinal view of B. (B and C) H. pylori is blue, CagA is red, and phosphotyrosine is green. Imaged and modeled on an Applied Precision DeltaVision Deconvolution System.

