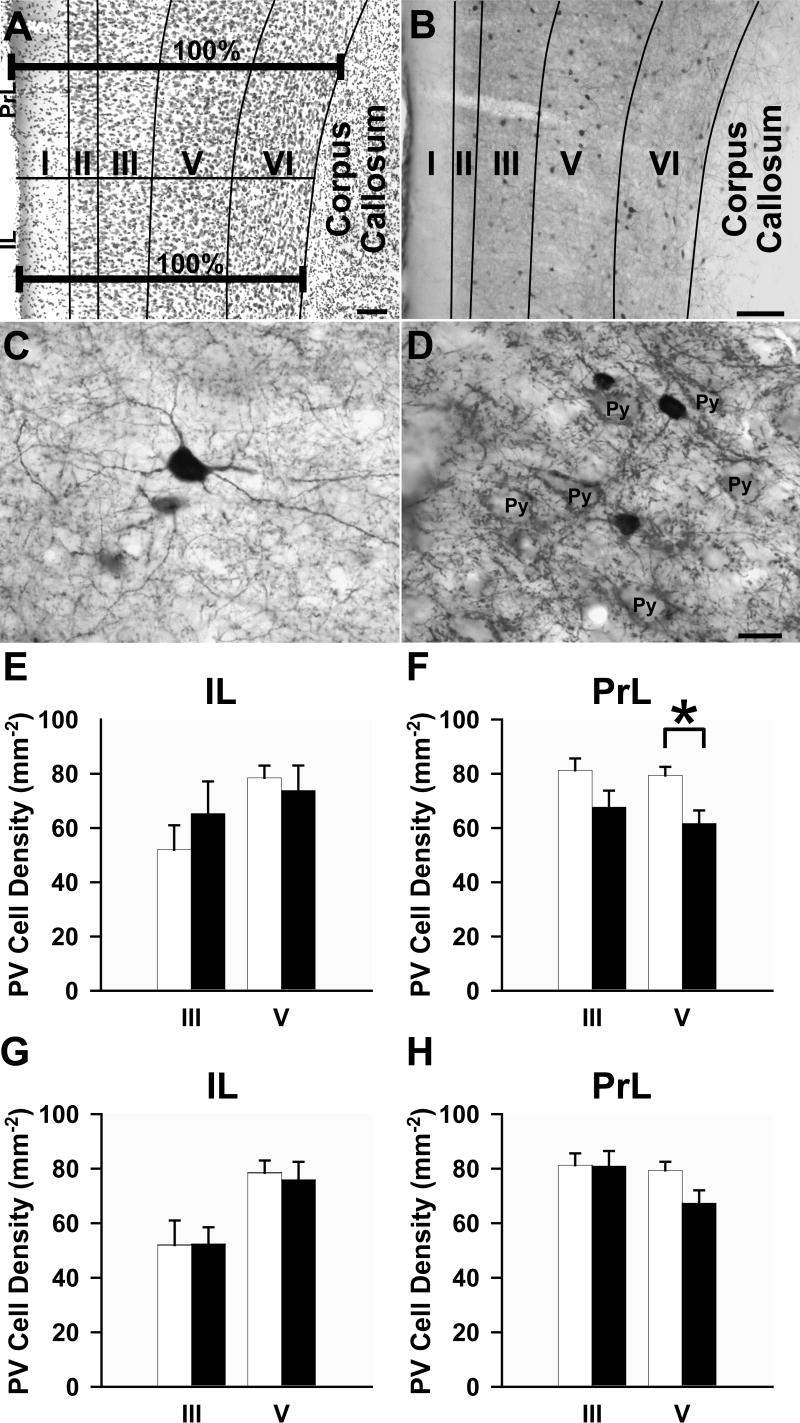
Figure 1.
(A) Light micrograph illustrating the laminar distribution of Nissl stained neurons and glia of the mPFC using the method of delineation described by Gabbott and colleagues (1997). (B) Representative light micrograph showing laminar distribution of PV+ interneurons in the mPFC using this same method. (C) Light micrograph of a multipolar PV+ interneuron. Note the fine dendritic processes. (D) Light micrograph illustrating unstained pyramidal cells (Py) surrounded by PV+ punctae. (E-H) Bar graphs illustrating the density of PV+ interneurons in layers III and V of the (E,G) IL and (F,H) PrL areas of the mPFC. Open bars, vehicle; filled bars, (E,F) repeated or (G,H) acute AMPH administration. Scale bars: A and B, 100 μm, D (also valid for C), 15 μm. *p < 0.05, repeated AMPH group has a significantly lower density of neurons compared to vehicle.

