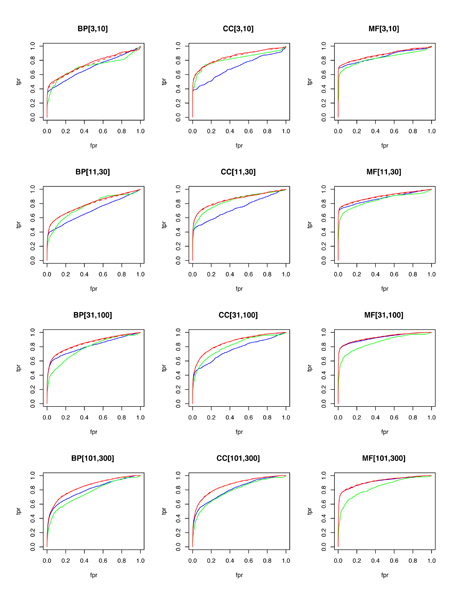
Figure 2.
ROC plots by pooled GO categories. Random forests are blue, functional linkage trees are green, combined classifier is red (dashed), and the combined/scaled classifier is red (solid). Fpr, false positive rate; GO, Gene Ontology; ROC, receiver operating characteristic; tpr, true positive rate.

