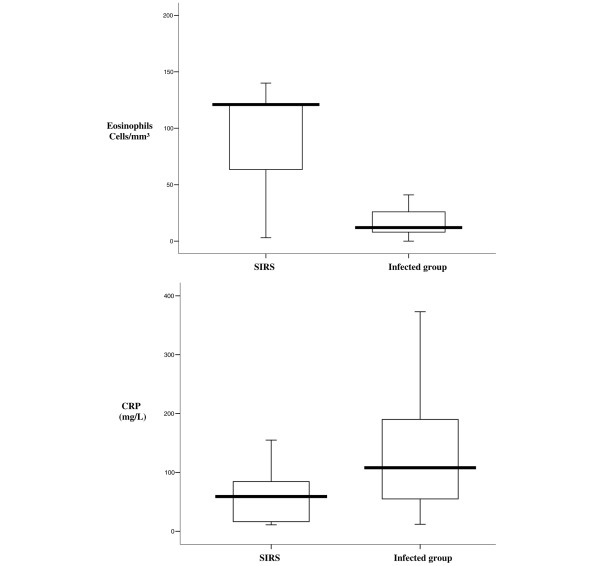
Figure 4.
Eosinophil cell count and C-reactive protein level for comparison of systemic inflammatory response syndrome and infection (P < 0.001). Box plot of eosinophil count and C-reactive protein (CRP) level for comparisons between the systemic inflammatory response syndrome (SIRS) group and the infected group (sepsis + severe sepsis + septic shock). Central line, median; boxes, 25th to 75th percentiles; whiskers, 95% confidence intervals.P < 0.001 between eosinophils and CRP groups.

