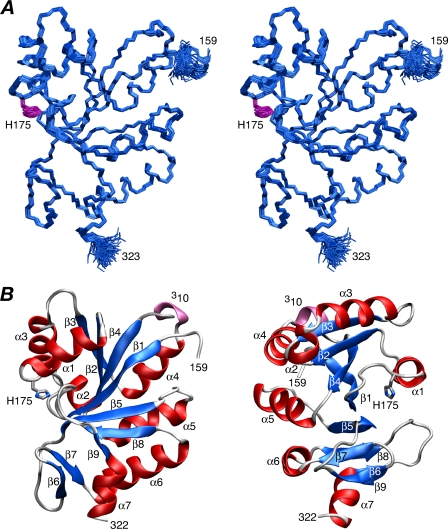
FIGURE 1.
Solution structure of IIBMan. A, stereoview of a best-fit superposition of 130 simulated annealing structures with the backbone (N, Cα, and C) atoms in blue and the side chain of the active site His-175 in purple. B, two approximately orthogonal views of a ribbon diagram of IIBMan with α-helices in red, sheets in blue, and the single 3-10 helix in lilac.

