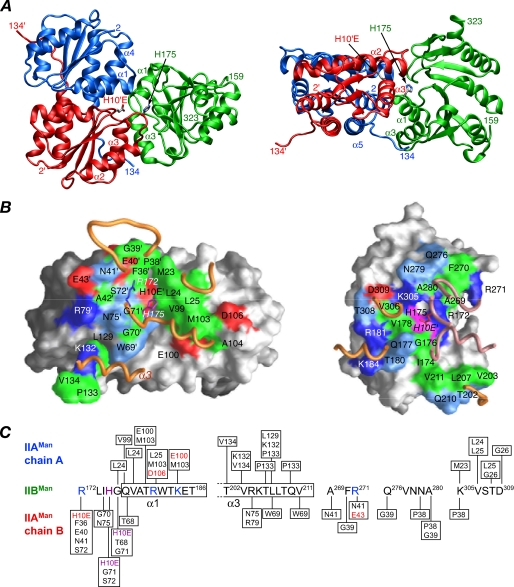
FIGURE 5.
Overall view of the productive, phosphomimetic IIAMan(H10E)-IIBMan complex. A, ribbon diagram with the A and B chains of IIAMan in blue and red, respectively, and IIBMan in green; the active site residues H10E′ of IIAMan (chain B) and H175 of IIBMan are also displayed. B, interaction surfaces for the productive IIAMan(H10E)-IIBMan complex. The left and right panels display the interaction surfaces on IIAMan and IIBMan, respectively. The surfaces are color coded as follows: hydrophobic residues are green, uncharged residues bearing a polar functional group are cyan, negatively charged residues are red, positively charged residues are blue, active site histidines are purple, and non-interfacial residues are gray (with a darker shade for the B subunit of IIAMan). Relevant portions of the backbone of the interacting partner are displayed as tubes (IIBMan in gold, A chain of IIAMan in gold, and B chain of IIAMan in lilac). The side chains of His-175 and Arg-172 of IIBMan are shown in the left-hand panel, and the side chain of H10E′ of the B chain of IIAMan is displayed in the right-hand panel (labeled in italics). C, diagrammatic representation of the intermolecular contacts with the active site histidines colored in purple, and residues involved in potential side chain-side chain intermolecular electrostatic interactions colored in red (acceptor) and blue (donor).

