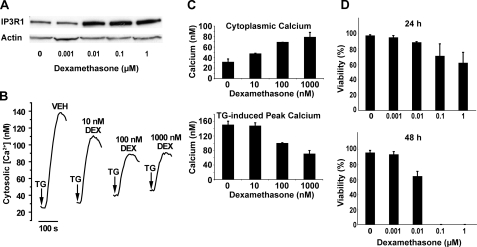
FIGURE 3.
Dose-response relationships between IP3R elevation and calcium alterations and cell death. A, an immunoblot, representative of five separate experiments, demonstrating the elevation of IP3R1 following treatment of WEHI7.2 cells with the indicated concentrations of dexamethasone for 24 h. B, calcium traces demonstrating the dexamethasone (DEX) dose dependence of cytoplasmic calcium elevation and decreased TG-releasable calcium in WEHI7.2 cells treated with the indicated concentrations of dexamethasone for 24 h. Arrows indicate the point of TG addition. Traces are representative of three separate experiments, each performed with duplicate samples. C, cytoplasmic calcium concentration and TG-induced peak calcium elevation in WEHI7.2 cells treated with the indicated concentrations of dexamethasone for 24 h. Error bars represent the mean ± S.E. (n = 3). D, WEHI7.2 cell viability at 24 and 48 h following treatment with the indicated concentrations of dexamethasone. Error bars represent the mean ± S.E. (n = 3). Note that viable cells were not detected at the 48-h time point following treatment with 0.1 and 1 μm dexamethasone.

