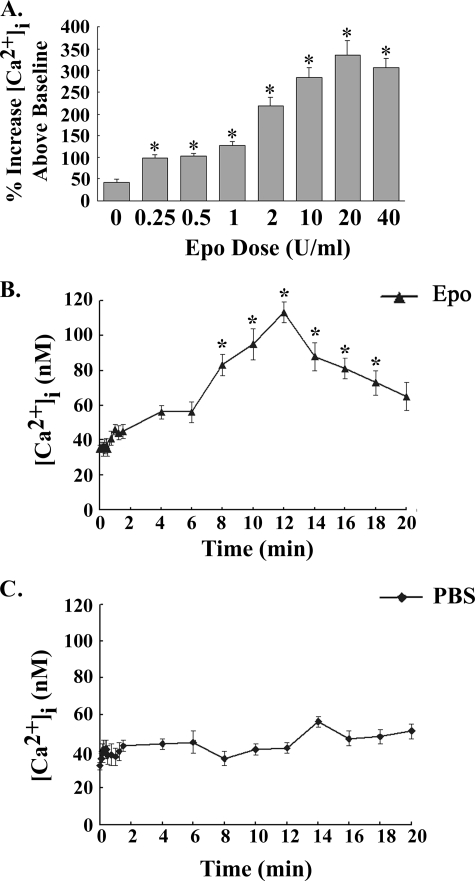
FIGURE 2.
Dose response and time course of [Ca2+]i after Epo stimulation of HEK 293T cells transfected with TRPC3 and Epo-R. A, Epo dose response. HEK 293T cells transfected with TRPC3 and Epo-R were stimulated with 0–40 units/ml Epo. [Ca2+]i was measured at 2–5-min intervals for 20 min. The peak percentage increase of [Ca2+]i above base line was calculated for each cell. Mean ± S.E. of the peak percentage increase above base line at each Epo dose is shown. 13–20 individual cells were studied at each dose in two experiments. *, a significant increase in [Ca2+]i compared with cells treated for 20 min with PBS (p < 0.0001). B and C, time course. HEK 293T cells transfected with TRPC3 and Epo-R were stimulated with 40 units/ml Epo. [Ca2+]i was measured at 5-s intervals for the first 30 s, at 15-s intervals for the next 60 s, and then at 2-min intervals for 20 min after simulation with Epo (B) or PBS (C). Mean ± S.E. [Ca2+]i (nm) of 20 (Epo) or 15 (PBS) cells measured at each time point is shown. *, a significant increase in [Ca2+]i in Epo-treated cells compared with those stimulated with PBS.

