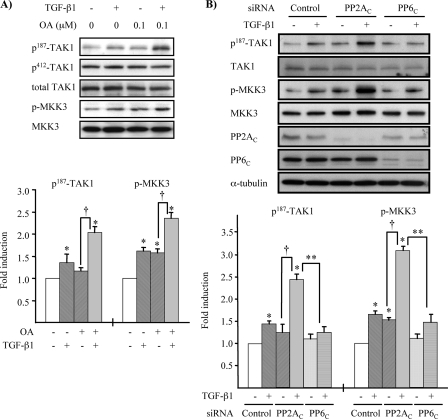
FIGURE 7.
Down-regulation of PP2A activity enhances TGF-β1-induced TAK1 and MKK3 phosphorylation. A, low dose OA increases TGF-β1-induced phosphorylation of Thr-187 in TAK1 and MKK3. MMC grown to subconfluence were rendered quiescent in medium supplemented with 0.5% FBS for 16 h and pretreated with 0.1 μm OA for 30 min, followed by treatment with TGF-β1 (2 ng/ml) for 5 min. Endogenous TAK1 and MKK3 phosphorylation were determined by Western blot analysis with anti-phospho-Thr-187-TAK1 (p187-TAK1), anti-phospho-Ser-412-TAK1 (p412-TAK1), and anti-phospho-MKK3/6 antibodies. Reblotting with anti-TAK1 (total TAK1) and anti-MKK3 antibodies was performed for loading controls. Quantitative analysis of levels of phospho-Thr-187-TAK1 and p-MKK3 was determined by densitometry, and data are presented as the mean ± S.E. band density quantified as the ratio to total TAK1 and MKK3 and normalized to nontreated conditions (*, p < 0.05 versus nontreated conditions; †, p < 0.05 versus OA pretreatment only). B, knockdown of PP2AC with siRNA enhances TGF-β1-induced phosphorylation of Thr-187 in TAK1 activation loop and MKK3. MMC transfected with siRNA targeted against PP2AC, PP6C, or control nontargeting siRNA (Control) were incubated in medium containing 15% FBS for 24 h and then rendered quiescent in medium supplemented with 0.5% FBS for 16 h prior to treatment with TGF-β1 (2 ng/ml) for 5 min. Endogenous TAK1 and MKK3 phosphorylation were determined by Western blot analysis with anti-phospho-Thr-187-TAK1 (p187-TAK1) and anti-p-MKK3/6 antibodies. Reblotting with anti-TAK1, anti-MKK3, and anti-α-tubulin antibodies served as loading controls. Reduction of PP2AC and PP6C protein expression was examined by Western blotting with anti-PP2AC and anti-PP6C antibodies. Densitometry data are presented as -fold increase in phospho-Thr-187-TAK1 or p-MKK3, quantified as the ratio to total TAK1 or MKK3, compared with control siRNA transfected cells without TGF-β1 treatment; the results represent mean ± S.E. of three independent experiments (*, p < 0.05 versus control siRNA-transfected cells without TGF-β1 treatment; **, p < 0.05 versus PP2AC siRNA-transfected cells with TGF-β1 treatment; †, p < 0.05 versus PP2AC siRNA-transfected cells without TGF-β1 treatment).

