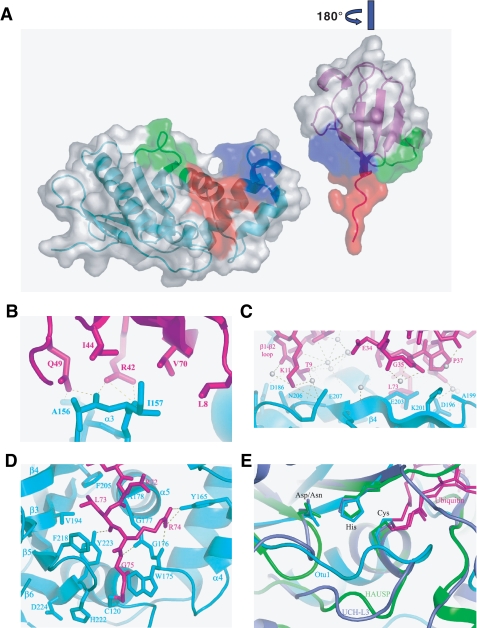
FIGURE 4.
The Otu1-ubiquitin interface. A, three regions of interaction between Otu1 and ubiquitin. The figure is rendered in a surface representation and shown in “open book” format highlighting contact regions 1 (blue), 2 (green), and 3 (red). B, close-up of Otu1-ubiquitin interactions in region 1. Side chains that mediate hydrogen bonds (dotted line) and van der Waals interactions are shown. C, close-up of Otu1-ubiquitin interactions in region 2. Water molecules are indicated as white spheres. D, close-up of Otu1-ubiquitin interactions in region 3. E, superimposed active sites of deubiquitinating enzymes. The catalytic triad cysteine, histidine, and aspartate as well as ubiquitin (magenta) are shown as a stick models. Otu1 is shown as cyan, UCH-L3 (Protein Data Bank code 1xd3) is shown in violet, and HAUSP/USP7 (Protein Data Bank code 1nbf) is shown in green.

