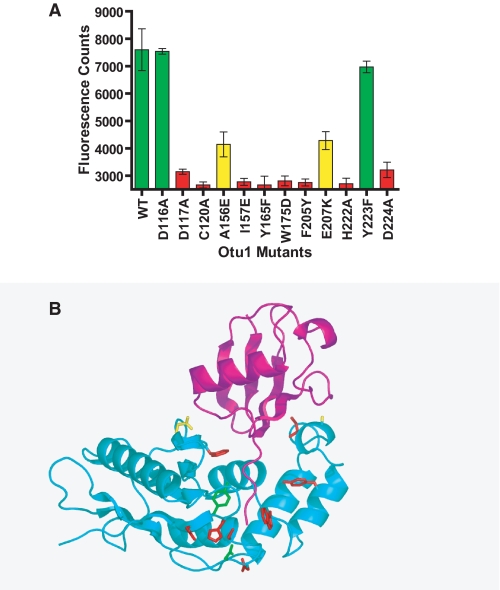
FIGURE 5.
Mutational analysis of the Otu1-ubiquitin interface. A, deubiquitinase activity of recombinant Otu1 and single site mutants. Each of the reactions was performed in triplicate and in the linear range of time and enzyme and substrate concentration. Activities are color-coded according to severity (green, wild type activity; yellow, about 50% of wild-type activity; red, less than 30% of wild-type activity). B, mapping of mutational studies onto the Otu1-ubiquitin complex. Side chains that were mutated in A are color-coded according to their severity on enzymatic activity as described in A.

