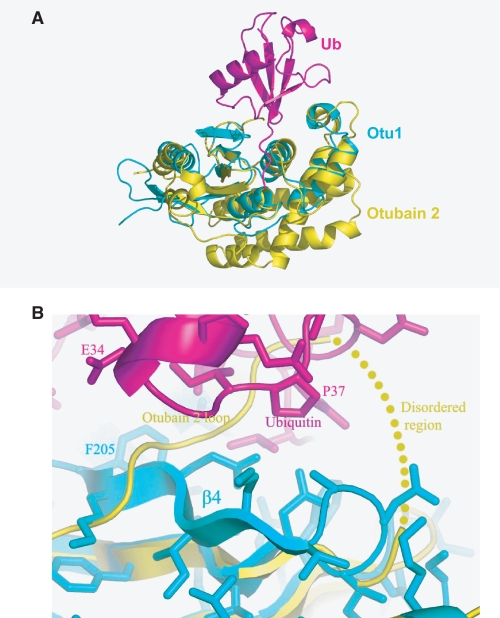
FIGURE 6.
Comparison of the Otu1-ubiquitin complex with otubain 2. A, superposition of the Otu1-ubiquitin complex (cyan and magenta, respectively) with nascent otubain 2 (yellow). B, close-up view of the β4-loop region of Otu1 (cyan) with bound ubiquitin (magenta) with the corresponding region of nascent otubain 2 (yellow).

