FIGURE 2.
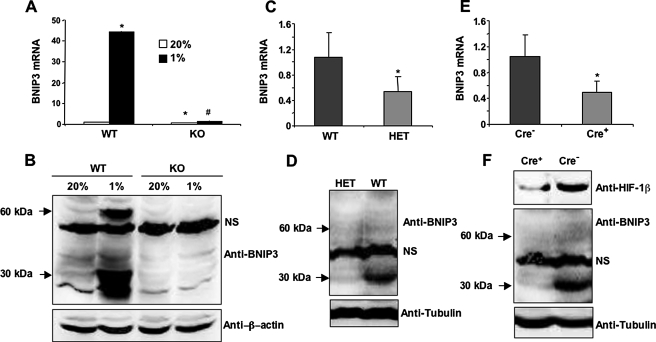
HIF-1-dependent induction of BNIP3 expression in hypoxic MEFs. A, BNIP3 mRNA was measured by quantitative real-time RT-PCR in WT and KO MEFs exposed to 20 or 1% O2 for 24 h. Mean values (±S.E.) are shown. *, p < 0.05 by Student's t test compared with WT MEFs at 20% O2;#, p < 0.05 compared with WT MEFs at 1% O2. B, BNIP3 and β-actin protein expression was measured by immunoblot assay using lysates from WT and KO MEFs exposed to 20 or 1% O2 for 48 h. C and D, BNIP3 mRNA (C) and protein (D) expression were analyzed in WT and HET mouse lung tissues. *, mean (±S.E., n = 3) that is significantly different from WT. Anti-tubulin immunoblot assay was performed to confirm equal protein loading. E and F, BNIP3 mRNA (E) and protein (F) levels were analyzed in Cre- and Cre+ mouse lung tissues. *, mean (±S.E., n = 3) that is significantly different from Cre-. Tubulin served as loading control. NS indicates a nonspecific band.

