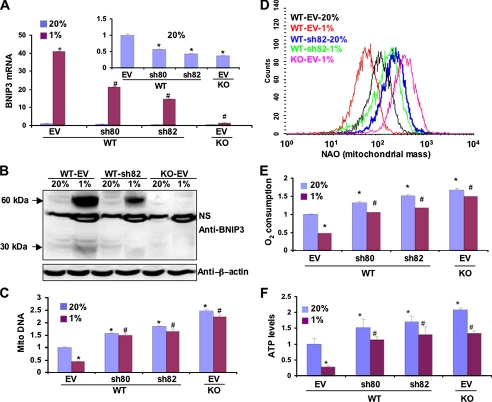
FIGURE 3.
Effect of BNIP3 loss-of-function on mitochondrial mass and respiration in WT and KO MEFs. A and B, quantitative real-time RT-PCR (A) and immunoblot analysis (B) showed down-regulation of BNIP3 mRNA and protein, respectively, by short hairpin RNAs sh80 and sh82 in cells incubated at 20 or 1% O2 for 24 h (A) or 48 h (B). β-Actin blot showed equal protein loading. NS, nonspecific band. C, D, E, and F, mitochondrial DNA content (C), mitochondrial mass (D), O2 consumption (E), and ATP levels (F) were measured in MEF subclones that were stably transfected with EV or vector encoding sh80 or sh82 and cultured at 20 or 1% O2 for 48 h. Data are presented as the mean (±S.E.). *, p < 0.05 by Student's t test compared with WT-EV MEFs at 20% O2;#, p < 0.05 compared with WT-EV MEFs at 1% O2.

