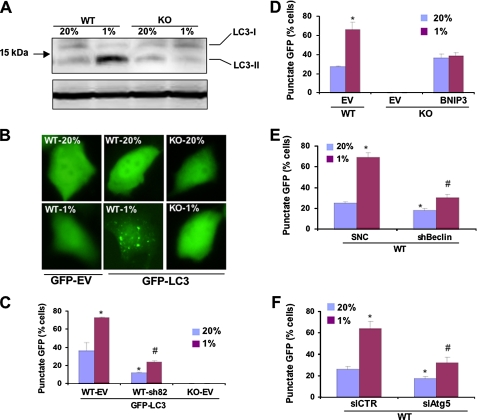
FIGURE 7.
HIF-1 activates BNIP3-, Beclin-1-, and Atg5-dependent autophagy in hypoxic MEFs. A, WT and KO MEFs were incubated at 20 or 1% O2 for 48 h, and whole cell lysates were subjected to immunoblot assay using an anti-LC3 antibody. B, WT and KO MEFs were transiently transfected with vector encoding GFP or GFP-LC3, incubated at 20% or 1% O2, and analyzed by fluorescence microscopy. C, KO-EV MEFs and WT MEF subclones, which were stably transfected with EV or vector expressing short hairpin RNA directed against BNIP3 (sh82), were transiently transfected with vector GFP-LC3, cultured at 20 or 1% O2, and analyzed by fluorescence microscopy. The percentage of cells exhibiting punctate fluorescence was calculated relative to all GFP-positive cells. Mean data (±S.E.) are shown. *, p < 0.05 compared with GFP-LC3-transfected WT-EV MEFs at 20% O2;#, p < 0.05 compared with GFP-LC3-transfected WT-EV MEFs at 1% O2. D, the percentage of cells with punctuate GFP-LC3 fluorescence was calculated relative to all fluorescent cells in WT-EV, KO-EV, and KO-BNIP3 MEF subclones. *, p < 0.05 compared with WT-EV at 20% O2. E, the percentage of cells with punctuate GFP-LC3 fluorescence was calculated in WT MEF subclones expressing short hairpin RNA directed against Beclin1 (shBeclin) or a SNC. Mean data (±S.E.) are shown. *, p < 0.05 compared with WT-SNC at 20% O2;#, p < 0.05 compared with WT-SNC at 1% O2. F, the percentage of cells with punctuate GFP-LC3 fluorescence was calculated in WT MEF subclones expressing small interfering RNA against Atg5 (siAtg5) or a negative control siRNA (siCTR). Mean data (±S.E.) are shown. *, p < 0.05 compared with WT-siCTR at 20% O2;#, p < 0.05 compared with WT-siCTR at 1% O2.

