FIGURE 7.
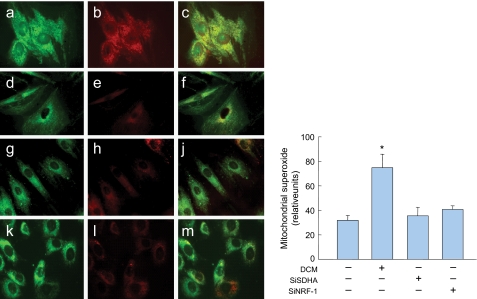
Mitochondrial ROS production in H9c2 cells. Confocal scanning laser microscopy images showing localization patterns of the Mitosox oxidant probe with mitochondrial-selective dye, MitoTracker Green in aerobic cells exposed to 100 μm DCM/CO for 6 h (panels a-c), and controls (panels d-f) or cells transfected with SDHa siRNA (panels g-j) or NRF-1 siRNA 24 h earlier (panels k-m). Histogram (right) quantifies Mitosox red fluorescence in mitochondria relative to MitoTracker Green. SDHa and NRF-1 silencing lack an effect on mitochondrial ROS production (Values are mean ± S.E. of 30 cells from each of three experiments; *, p < 0.01 compared with control).

