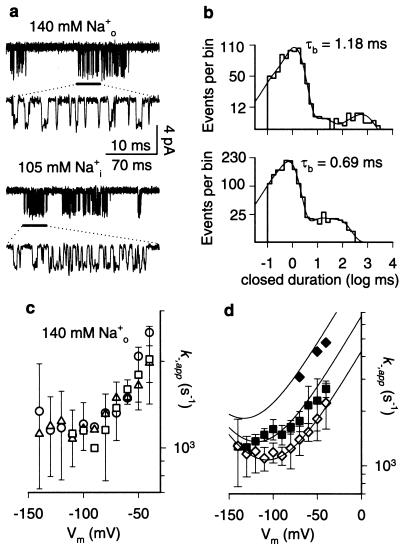
Figure 3.
τb and k−,app depend on [Na+]o. (a) Single-channel currents activated by 5 μM NMDA + 10 μM glycine during block by 30 μM Mgo2+ at −90 mV with [Cs+]i = 130 mM and the indicated [Na+]o. In each pair of current traces, the section of the upper single-channel record indicated by the horizontal bar is replotted below the bar at higher time resolution. (b) Closed-time histograms corresponding to the currents shown in a to the left of each histogram. Lines are four-exponential fits to the histograms. Number of events in each histogram is more than 1,000. (c) Voltage dependence of k−,app in three different [Cs+]i. Symbol meanings are as in legend to Fig. 1 c and d. (d) Voltage dependence of k−,app in three different [Na+]o. Because k−,app does not depend on [Cs+]i (c), points are averages of data at a single [Na+]o and one or more [Cs+]i. ⋄, 140 mM Nao+; ■, 105 mM Nao+; ⧫, 70 mM Nao+. Lines are drawn by using Eq. 3, with parameter values given in Table 1.

