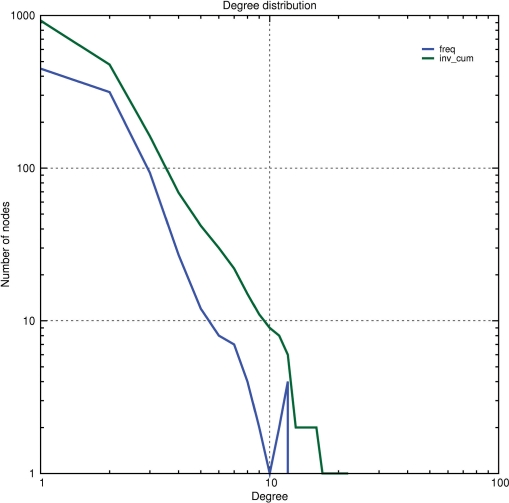
Figure 2.
Node degree distribution of a yeast protein interaction network obtained from two-hybrid data. The distribution was computed with the program graph-topology and plotted on log scales for both the abscissa and ordinates. The linear shape of the curve on the log–log graph suggests that this network follows a power-law distribution of degree. Color code : blue, absolute frequency; green, reverse cumulative frequency.

