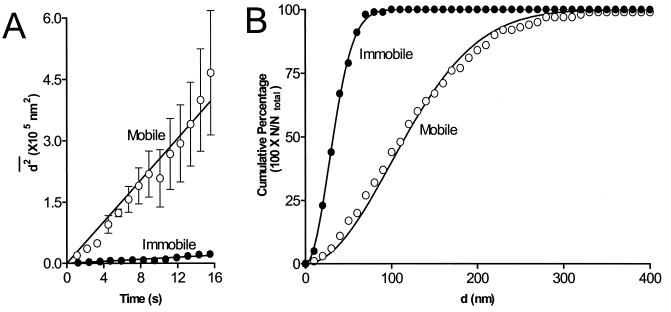
Figure 3.
Secretory vesicles move by diffusion. (A) d2 vs. time plots for rapid, mobile, and slow, immobile vesicles. Note that both sets of data can be fit with straight lines yielding diffusion coefficients of 6.1 × 10⁻¹¹ cm2/s for the mobile vesicles and 3.1 × 10⁻¹² cm2/s for the immobile vesicles. n ≥ 15 for each point. (B) Cumulative plots of number of trajectory steps vs. distance traveled. Note that both sets of data can be fit by the relationship predicted by diffusion (see text). Data included 152 points from 6 representative immobile vesicles and 145 points from 7 representative mobile vesicles labeled with the inducible construct sampled at 0.9 Hz. Calculated diffusion coefficients were 4.6 × 10⁻¹¹ cm2/s for the mobile vesicles and 3.3 × 10⁻¹² cm2/s for the immobile vesicles.

