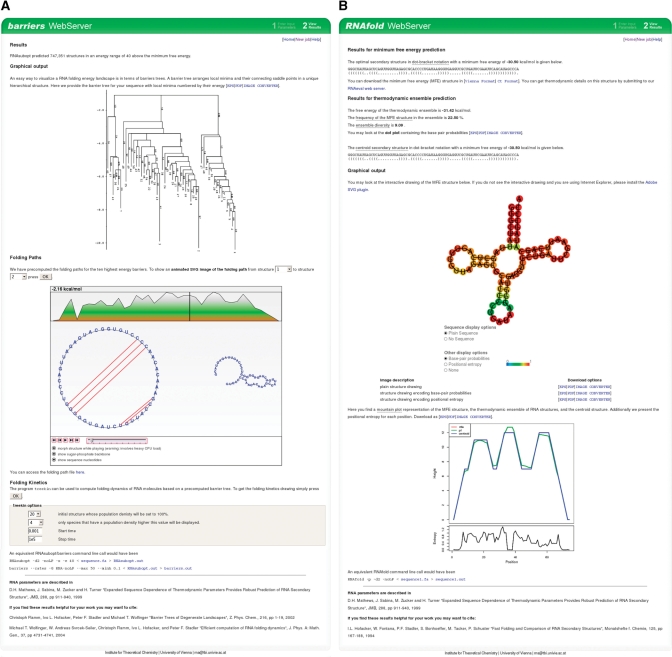
Figure 1.
(A) Screenshot of a sample output of the barriers server. We display the barrier tree and provide the transition rates matrix for download. Folding pathways between the 10 best local minima can be explored via an interactive, animated SVG file. For folding kinetic analysis, we provide an interface to the treekin program. The user can select an initial structure and a time interval. Results of the simulation will be automatically loaded into the results page. Note that simulations can be run without the need to recalculate the barrier tree. (B) Screenshot of a sample output of the RNAfold web server. The output is grouped into three sections. First, we provide results for the minimum free energy (MFE) prediction in form of the secondary structure in dot bracket notation and the free energy. Second, we list results from partition function folding, which are the ensemble free energy, the frequency of the MFE structure, the ensemble diversity and base-pairing probabilities in form of a dot plot. Additionally, we provide the centroid structure in dot bracket notation. Last, there are various graphical representation such as a secondary structure drawing and a mountain plot. An SVG file is embedded into the page to interactively explore reliability information in terms of base-pairing probabilities or positional entropy.

