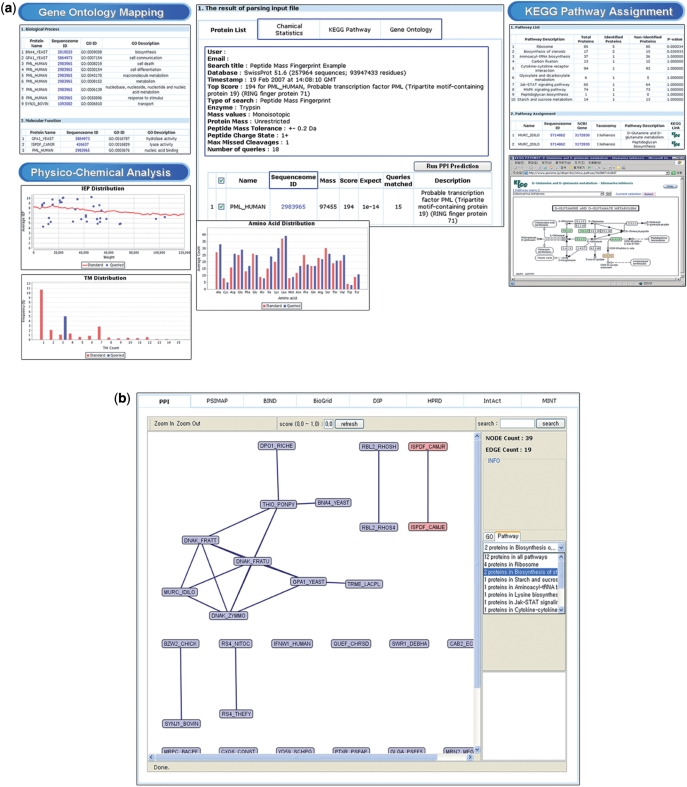
Figure 2.
Screenshots of MassNet annotation results. (a) Panel in the middle is the protein list table. KEGG Pathway tab shows KEGG pathway assignment and metabolic pathway graph (right panels). Gene Ontology tab shows proteins assigned to GO categories (left top panel). Chemical Statistics tab shows the input protein set's physico-chemical distribution against whole protein distribution of the organism (left bottom panels). (b) Protein-protein interactions of user-selected proteins are visualized by a network viewer. Rectangular shapes are protein nodes. The black connecting lines indicate interactions among the nodes. The two red rectangular nodes are proteins that are selected by the users through the right hand side panel. When users select the right pull down menus in the right panel, the left drawing canvas shows highlighted protein nodes.

