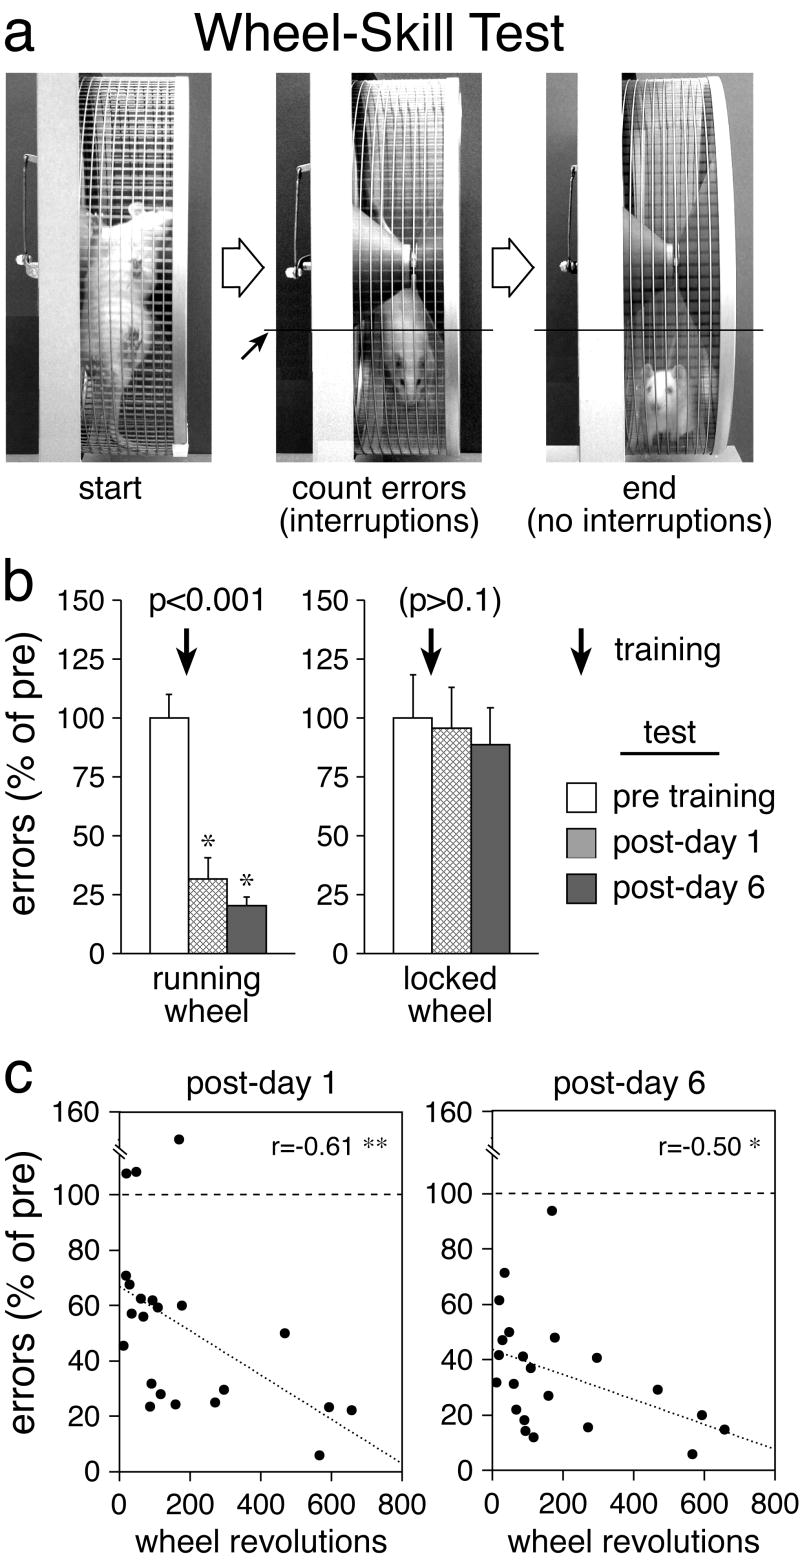
Fig. 1.
Motor-skill learning on the running wheel. a Video stills depict a rat during the wheel-skill test. To start, the wheel with the rat is rotated by 90 degrees (left) and released. The number of interruptions of a line marked on the video monitor (small arrow) by the rat’s body minus tail (middle) is counted until the rat fails to interrupt for 3 sec (right) (see Methods). During the running-wheel training, the rat learns to control/balance the wheel in order to reduce such swinging. These swings (interruptions) serve as an index of performance error. b The number (mean±SEM) of swings (errors) committed during the wheel-skill test before (pre) and 1 and 6 days after (post) a 2-day wheel training (60-min sessions, arrow), expressed as percentage of mean pre-test values, are shown for rats trained on a running wheel or on a locked wheel. The p values for the overall training effect (Friedman test) are also shown. * p<0.05, vs. pre (Wilcoxon test). c Scatter plots depict, for individual animals, the relationship between the total number of wheel revolutions during a 2-day training and the number of performance errors committed during skill tests 1 and 6 days after this training (expressed as percentage of pre-test values). ** p<0.01; * p<0.05.

