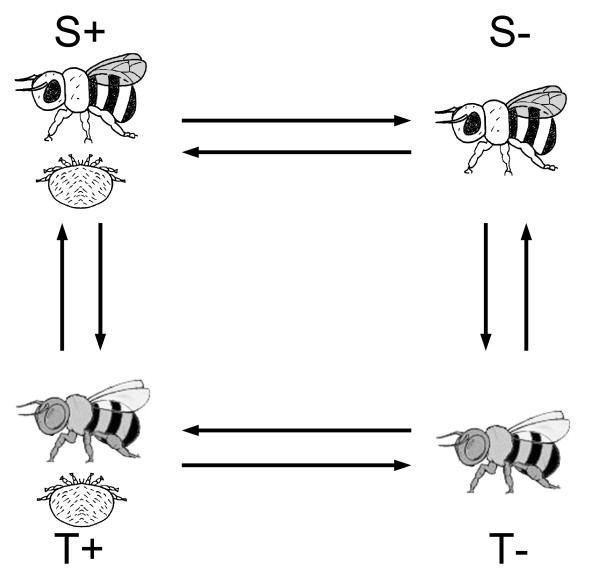
Figure 3.
Microarray experimental design. For all experiments, arrows indicate microarray hybridizations (arrow tail, Cy3-labeled sample; arrowhead, Cy5-labeled sample). Varroa parasitized (+) and non-parasitized (-) full-sister pupae, from two different genetic stocks: one susceptible (S) and one tolerant (T) to Varroa were compared. Dye swaps were made for all comparisons.

