Fig. 4.
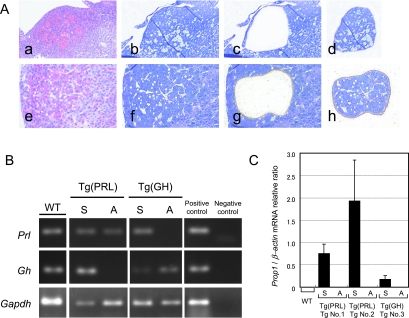
RT-PCR analysis of Prl, Gh and Prop1 expression in PRLomas and GHoma sampled by laser microdissection (LCM). Dividing between the adenoma and non-diseased pituitary by LCM (A). PRLoma (a–d) and GHoma (e–h) were identified in different Prop1 Tg. All sections were stained by H&E (a, e) and toluidine blue (b, f). Tissues were divided into adenomatous nodules (d, h) or these surrounding pituitary regions (c, g) by LCM. RT-PCR analysis of Gh and Prl (B). mRNA from LCM samples was reverse transcribed. RT-PCR analysis reveals Prl (117 bp), Gh (173 bp) and Gapdh (143 bp) fragments. The Cga-Prop1 Tg does not express Gh mRNA in PRLoma, nor Prl mRNA in GHoma, in agreement with the results of immunohistochemistry (Fig. 2). Quantitative RT-PCR analysis of Prop1 expression (C). Prop1 mRNA expressions were analyzed by quantitative RT-PCR. Prop1 is expressed in the hyperplastic surrounding regions of the adenomas. Prop1 expression is not observed in PRLoma and GHoma. M, 50 bp ladder marker; WT, wild-type; Tg (PRL), Prop1 Tg with PRLoma; Tg (GH), Prop1 Tg with GHoma; S, surrounding anterior pituitary region of adenoma; A, adenoma; Positive control, cDNA from normal fresh mouse pituitary; Negative control, non-template control.

