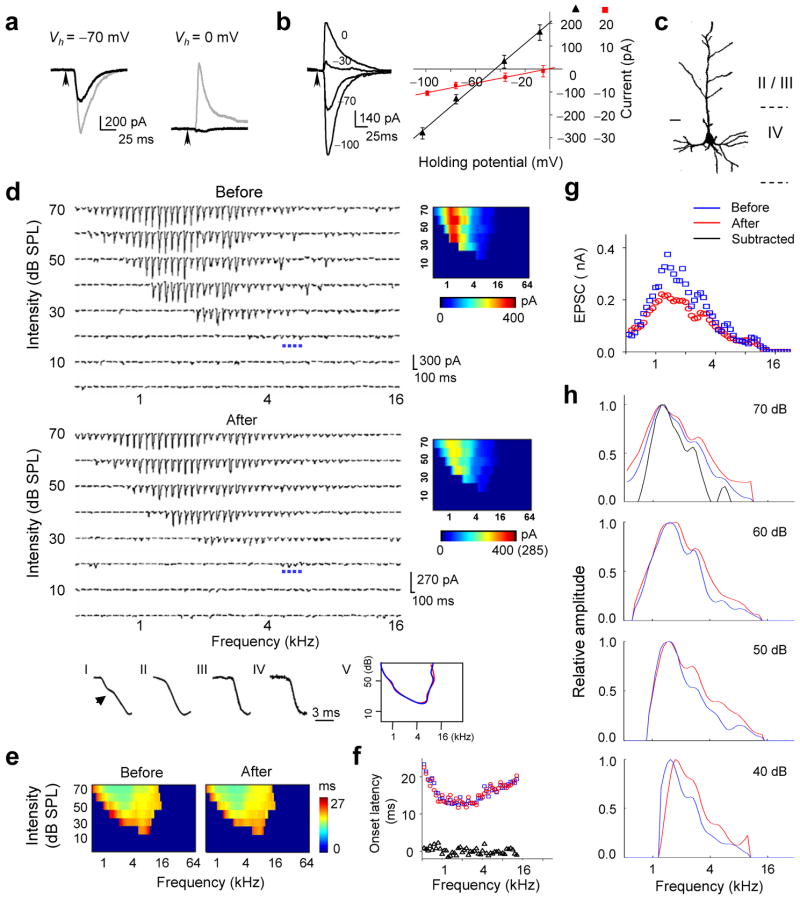
Figure 2.
Changes in excitatory synaptic TRF after local cortical silencing. (a) Excitatory (left) and inhibitory (right) synaptic currents evoked by a tone of 1.5 kHz and 70 dB before (gray) and after (black) cocktail application. (b) Left, synaptic currents (average of five repeats) evoked by a tone of 1.9 kHz and 70 dB recorded at different holding potentials. Right, I –V curves (V is corrected) for synaptic currents averaged within a 20–22.5 ms window after the stimulus onset (black) and 0–1 ms window after the response onset (red). (c) Morphology of this recorded cell. Bar, 20 μm. (d) TRF of excitatory synaptic currents before (average of two repeats) and after (four repeats) silencing. Blue dots mark the responses at the intensity threshold (20 dB). The color maps show the average amplitudes. Number in the bracket indicates the original scale before correction. Bottom, I–IV, the rising phase of average synaptic response to a 1.3 kHz tone at 60 dB (I/II) or a 5.6 kHz tone at 20 dB (III/IV) before (I/III) and after (II/IV) cortical silencing. (e) Color map of onset latencies of evoked excitatory currents. (f) Onset latencies (at 70 dB) before (blue) and after (red) cocktail application. Triangle represents the difference. (g) Amplitudes of responses before (blue) and after (red) cocktail application at 70 dB. (h) Tuning curves of excitatory currents at four different tone intensities. The black line represents the tuning curve of subtracted responses (before minus after).

