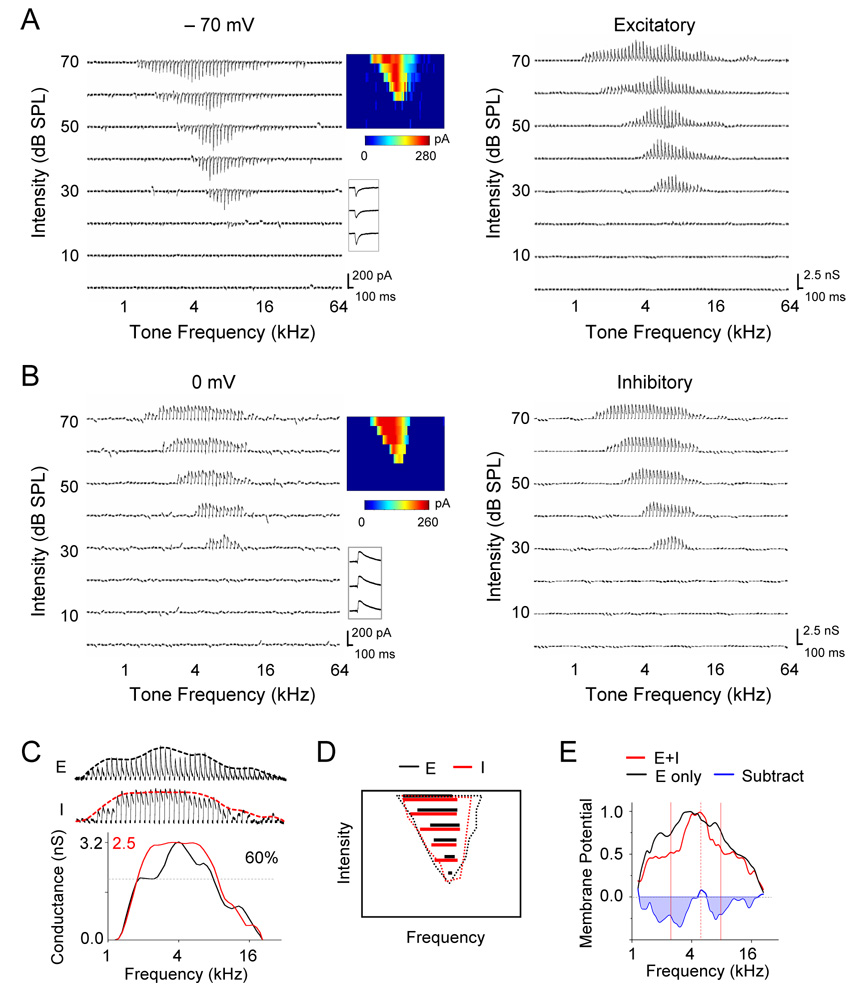
Figure 1. Frequency Tuning of Synaptic Inputs in an example A1 Excitatory Neuron.
(A and B) Left, excitatory (A) and inhibitory (B) synaptic currents recorded in an example neuron at −70 mV and 0mV, respectively, in response to pure tones of various frequencies and intensities. Each small trace represents response to a tone (averaged from two repeats). Middle, color maps represent the TRFs of synaptic responses, with the color of each pixel indicating the peak amplitude of synaptic currents. Inset below the color map shows individual traces of synaptic currents responding to a best-frequency tone at 40, 50, 60 dB sound pressure level (SPL). Right, TRFs of excitatory and inhibitory synaptic conductances, which were derived from the averaged synaptic currents.
(C) The enlarged profile of excitatory (upper) and inhibitory (middle) conductances at 70 dB SPL for the same cell (cell1). Envelops, i.e. frequency tuning curves, were calculated from the peak amplitudes of synaptic conductances and were indicated by the dashed lines. Bottom, the inhibitory tuning curve was superimposed with the excitatory curve. The black and red scale values are for the excitatory and inhibitory curve respectively.
(D) Dotted lines depict the boundary of TRF of excitatory (black) and inhibitory (red) input for the same cell. Colored solid lines indicate the frequency ranges for responses with amplitudes larger than 60% of maximum value at each testing intensity. Black: excitatory; red: inhibitory.
(E) Frequency tuning curve of derived peak membrane potential responses when only excitatory input was considered (black) or when both excitatory and inhibitory inputs were considered (red). The tuning curves are normalized. The subtraction between the two curves is shown by the blue line. Dashed red vertical line indicates the frequency for the peak response, and two solid red vertical lines indicate the estimated frequency range of spike responses.

