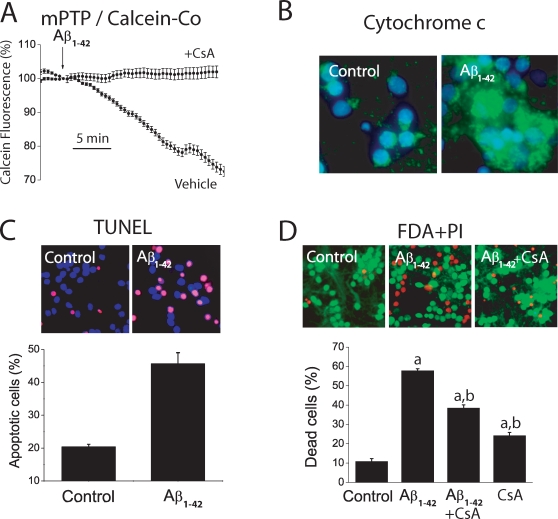
Figure 4. Aβ1–42 oligomers induce mPTP opening, cytochrome c release, apoptosis and cell death.
A. Mitochondrial permeability transition was assessed directly by the calcein/Co2+ method. Cerebellar granule cells were loaded with calcein/AM 1 µM and CoCl2 1 mM for 15 min at 37°C and calcein fluorescence quenching was imaged. Traces correspond to mean±SEM fluorescence records normalized to the value before the addition of oligomeric Aβ1–42 (500 nM) in responsive cells (n = 16 cells, vehicle) or in cyclosporin (1 µM) treated cells. Representative of 3 experiments. B. Location of cytochrome c was assessed by immunofluorescence against cytochrome c. Cerebellar granule cells were cultured for 72 h in vehicle or 500 nM Aβ1–42 oligomers. Blue colors show nuclei stained with DAPI. Green colors show location of cytochrome c. Control cells show punctate distribution of cytochrome c. Aβ oligomers-treated cells show a more diffuse location of cytochrome c due to release of cytochrome c from mitochondria. Representative of 3 independent experiments. Scale bar represents 10 µm. C. Cerebellar granule cells were cultured for 72 h in vehicle or Aβ1–42 oligomers (500 nM) and apoptosis was tested by TUNEL assay. Pictures show nuclei (blue) and apoptotic cells (purple). Bars show % of apoptotic cells. (n = 3; *p<0 05). Scale bar represents 10 µm. D. Cerebellar granule cells were cultured for 72 h with vehicle (control) or Aβ1–42 oligomers (500 nM) and cell death was assessed by staining with FDA (green living cells) and PI (red dead cells, scale bar represents 10 µm. Shown are also the effects cyclosporin A (1 µM) on Aβ1–42 oligomers-induced death in cerebellar granule cells (n = 3; ap<0 05 vs control; bp<0 05 vs Aβ1–42). Representative of 3 independent experiments.

