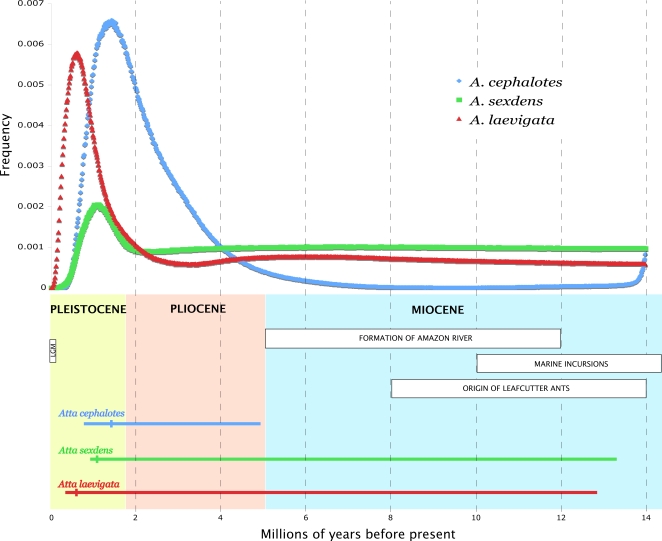
Figure 5. Timeline of diversification in Amazonian Atta species.
Top: Posterior distributions of Tdiv, the time since the oldest population division for each species as reconstructed for each species using the program IM. Bottom: The 95% confidence limits for diversification in each species are represented by horizontal bars, with a vertical bar indicating the best estimate for Tdiv, assuming a mutation rate of 9.5 substitutions per site per million years and a generation time of 4 years.

