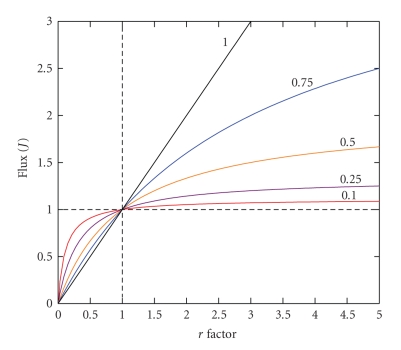
Figure 10.
Effect on flux when one or more enzymatic activities with different control coefficients are varied. This figure represents an enzyme or group of enzymes in which their CviJ sum is indicated in parenthesis and is modified by the same r factor. Number 1 represents the reference control, thus if r < 1, there is suppression, whereas r > 1 represents overexpression.

