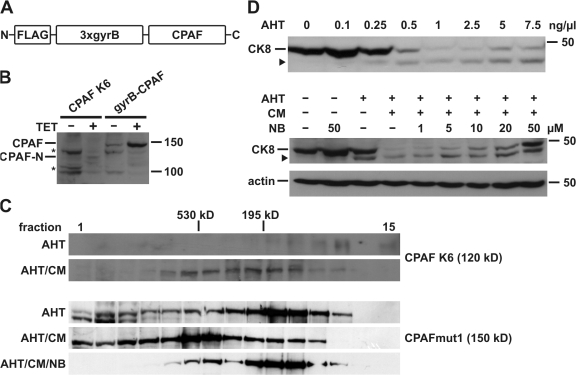
Figure 1.
CPAF is activated by induced proximity. (A) Schematic representation of the gyrB-CPAF construct. CPAF was placed under the control of a tetracycline-inducible promoter. FLAG, FLAG tag; 3xgyrB, three consecutive copies of an N-terminal fragment of gyrase B from Escherichia coli; CPAF, CPAF from Chlamydia trachomatis (amino acid residues 18–601). (B) CPAF expression in T-Rex-293 cells. Expression of CPAF was induced by tetracycline (TET) either in CPAF K6 cells stably expressing gyrB-CPAF or T-REx-293 cells transfected with the gyrB-CPAF construct. CPAF-N indicates an N-terminal fragment of gyrB-CPAF after proteolytic activation. Triton X-100 cell extracts were analyzed by Western blotting with an antibody specific for the FLAG tag. Asterisk, unspecific signal. Molecular size markers (in kD) are indicated. (C) Size exclusion chromatography of CPAF. Cell extracts of either CPAF K6 cells (top) or T-REx-293 cells transfected with the CPAFmut1 (carrying the S491A active-site mutation; bottom) were separated on a Superose 200 gel filtration column. Anhydrotetracycline (AHT), coumermycin (CM), or novobiocin (NB) were used as indicated. The elution fractions and eluted molecular size markers are indicated. (D) Activation of CPAF by induced proximity. CPAF expression was induced in CPAF K6 cells with increasing amounts (top) of AHT or using 0.5 ng/ml (bottom). Before addition of CM, cells were preincubated with indicated amounts of NB. Samples were analyzed by Western blotting using anti-CK8 antibodies. The arrowhead indicates a cleavage product of CK8. Detection of actin served as a loading control.

