Figure 5.
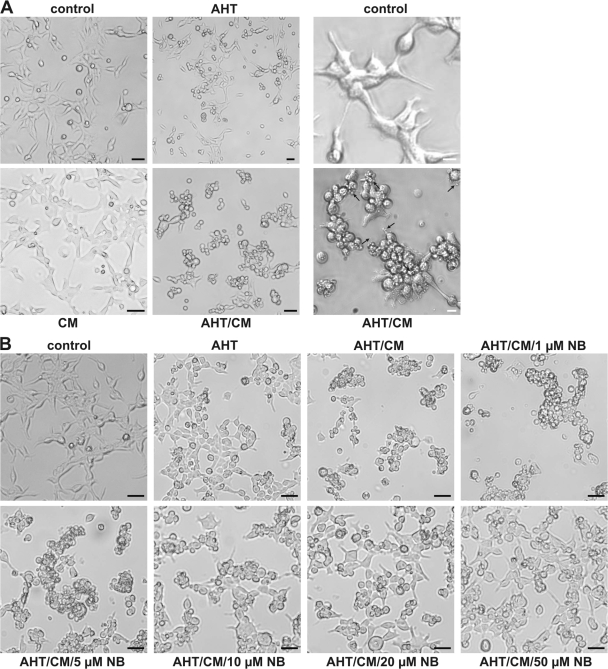
CPAF expression leads to changes in cellular morphology. (A) Changes in cell morphology during CPAF expression. CPAF K6 cells were incubated either with 6 ng/ml AHT, CM, or both for 16 h. Cells were analyzed by light microscopy (left). Arrows indicate smaller vesicular fragments. Black bar, 10 μm. The right panel shows an enlarged section of either a control sample or a sample treated with AHT and CM. White bar, 3 μm. (B) Inhibition of CPAF oligomerization by novobiocin. CPAF expression was induced in CPAF K6 cells by adding AHT, or cells were left untreated. 30 min before addition of CM, the cells were incubated with indicated amounts of NB. Cells were analyzed by light microscopy. Bar, 10 μm.

