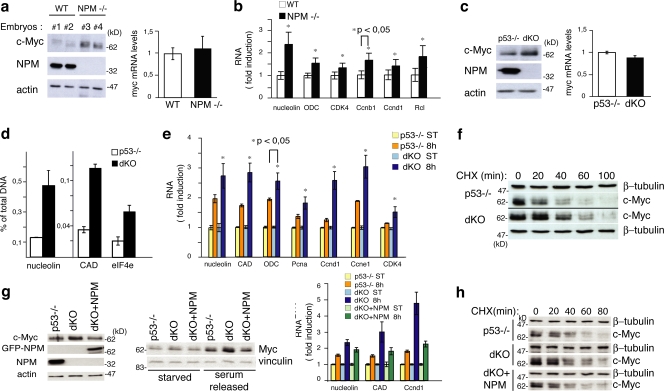
Figure 1.
NPM regulates c-Myc protein stability. (a, left) WB analysis of two NPM WT (Nos. 1 and 2) and knockout (KO; Nos. 2 and 3) embryos at 10.5 d post coitum (Colombo et al., 2005). (right) c-Myc mRNA levels in the same embryos evaluated by QPCR (results are normalized against WT samples). (b) Expression of c-Myc target genes analyzed by QPCR using mRNA from WT and NPM KO embryos. Expression was standardized with ubiquitin and normalized against the control WT RNAs. (c) c-Myc protein levels (left) and c-Myc mRNA levels (right) in p53−/− and dKO MEFs. (d) QPCR of anti c-Myc ChIP. The percentage of DNA bound to c-Myc was calculated as described previously (Frank et al., 2001). (e) QPCR analysis of c-Myc target genes at 8 h after serum treatment. Results analyzed as in panel b. (f) c-Myc protein level in p53−/− and dKO MEFs. Cells were treated with CHX and harvested at the indicated time points. (g, left) c-Myc protein levels in p53−/− and dKO MEFs infected with retroviruses expressing the GFP-NPM1 protein (+NPM) or control retroviruses. (middle) WB analysis of the same cells during serum starvation and upon serum release. (right) QPCR analysis of c-Myc target gene expression after serum treatment (8 h) as in panel d. (h) c-Myc protein level in p53−/−, dKO, and dKO + GFP-NPM MEFs as described in panel f. Data represent the mean of three determinations ± SEM.

